
Compare New Light Indust with Similar Stocks
Dashboard
Weak Long Term Fundamental Strength with a -18.62% CAGR growth in Net Sales over the last 5 years
- Low ability to service debt as the company has a high Debt to EBITDA ratio of 0.01 times
- The company has been able to generate a Return on Equity (avg) of 4.33% signifying low profitability per unit of shareholders funds
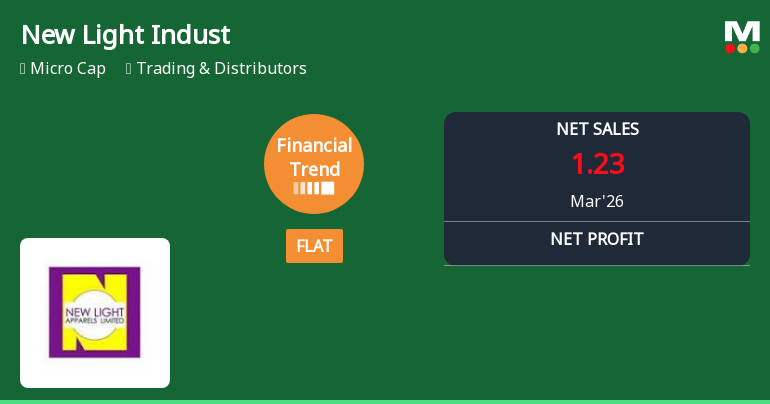
Flat results in Mar 26
With ROE of 2.8, it has a Expensive valuation with a 0.8 Price to Book Value
Reducing Promoter Confidence
Consistent Underperformance against the benchmark over the last 3 years
Stock DNA
Trading & Distributors
INR 12 Cr (Micro Cap)
28.00
23
0.00%
-0.05
2.84%
0.82
Total Returns (Price + Dividend) 
New Light Indust for the last several years.
Risk Adjusted Returns v/s
Returns Beta

News
New Light Industries Ltd Reports Flat Quarterly Performance Amidst Lingering Financial Challenges
New Light Industries Ltd, a micro-cap player in the Trading & Distributors sector, has reported a flat financial performance for the quarter ended March 2026, signalling a pause in its previously negative trend. Despite a modest improvement in its financial trend score, the company continues to face significant operational challenges, reflected in its weak liquidity and profitability metrics.
Read full news article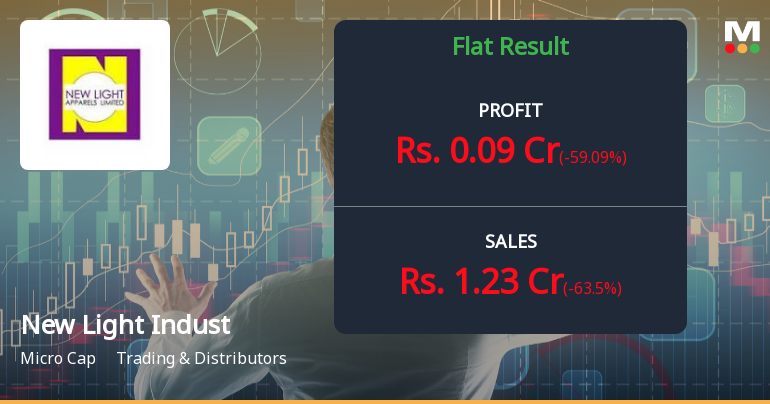
New Light Industries Q4 FY26: Revenue Collapse Deepens as Micro-Cap Struggles Continue
New Light Industries Ltd., a micro-cap trading and distribution company with a market capitalisation of ₹12.09 crores, reported deeply concerning results for Q4 FY26 (January-March 2026), with net sales plunging 63.50% year-on-year to ₹1.23 crores from ₹3.37 crores in the corresponding quarter last year. Net profit stood at ₹0.09 crores, down 59.09% from ₹0.22 crores in Q4 FY25, reflecting the severe operational distress facing this Delhi-based apparel manufacturer.
Read full news article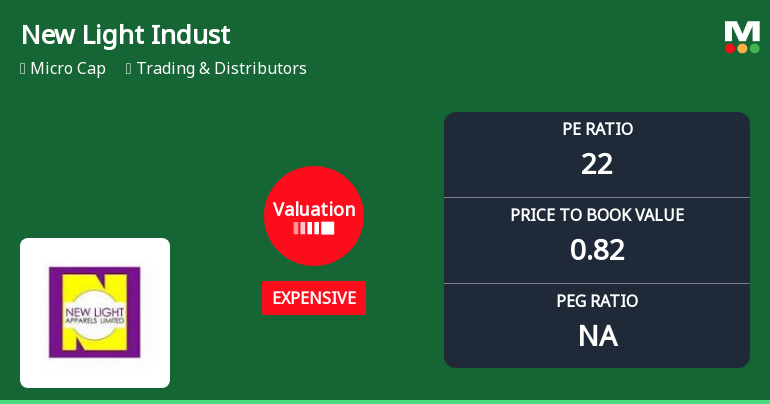
New Light Industries Ltd Valuation Shifts Signal Elevated Price Risk
New Light Industries Ltd, a micro-cap player in the Trading & Distributors sector, has seen its valuation parameters shift notably, raising questions about its price attractiveness relative to historical and peer benchmarks. Despite a stable share price at ₹1.38, the company’s price-to-earnings (P/E) ratio has moved into the expensive territory, prompting a downgrade in its Mojo Grade to Strong Sell as of 09 June 2025.
Read full news article Announcements
Announcement under Regulation 30 (LODR)-Newspaper Publication
01-Jun-2026 | Source : BSENewspaper Publication for the Audited Financial Results of the company for year ended 31th March 2026.
Submission Of Audited Financial Results For The Quarter And Year Ended 31St March 2026 Pursuant To Regulation 33 Of SEBI (Listing Obligation & Disclosure Requirements) Regulation 2015
30-May-2026 | Source : BSESubmission of Audited Financial Results for the quarter & FY ended on 31st March 2026.
Board Meeting Outcome for Outcome Of Board Meeting Pursuant To Regulation 30 Of SEBI (Listing Obligation & Disclosure Requirements) Regulation 2015
30-May-2026 | Source : BSESubmission of Audited Financial Results for the quarter and year ended 31st March 2026 pursuant to Regulation 33 of SEBI (Listing Obligation & Disclosure Requirements) Regulation 2015.
Corporate Actions

No Upcoming Board Meetings

No Dividend history available

New Light Industries Ltd has announced 1:10 stock split, ex-date: 10 Oct 24

No Bonus history available

No Rights history available
Quality key factors
Valuation key factors
Technicals key factors
 Technical Indicator Scale: Bearish, Mildly Bearish, Sideways, Mildly Bullish, Bullish Turned
 Shareholding Snapshot : Mar 2026
Shareholding Compare (%holding)
Non Institution
None
Held by 0 Schemes
Held by 0 FIIs
Meetu Makkad (1.14%)
Manoj Agrawal (huf) (9.01%)
81.91%
Quarterly Results Snapshot (Standalone) - Mar'26 - YoY

YoY Growth in quarter ended Mar 2026 is -63.50% vs -42.69% in Mar 2025
YoY Growth in quarter ended Mar 2026 is -59.09% vs -42.11% in Mar 2025
Half Yearly Results Snapshot (Standalone) - Sep'25
Growth in half year ended Sep 2025 is -27.20% vs 235.52% in Sep 2024
Growth in half year ended Sep 2025 is -13.89% vs 1,000.00% in Sep 2024
Nine Monthly Results Snapshot (Standalone) - Dec'25
YoY Growth in nine months ended Dec 2025 is -57.75% vs 124.80% in Dec 2024
YoY Growth in nine months ended Dec 2025 is -63.74% vs 4,650.00% in Dec 2024
Annual Results Snapshot (Standalone) - Mar'26
YoY Growth in year ended Mar 2026 is -58.90% vs 43.15% in Mar 2025
YoY Growth in year ended Mar 2026 is -63.16% vs 208.11% in Mar 2025
About New Light Industries Ltd

Company Coordinates


