
Compare Newgen Software with Similar Stocks
Stock DNA
Computers - Software & Consulting
INR 7,703 Cr (Small Cap)
23.00
21
1.08%
-0.61
18.82%
4.44
Total Returns (Price + Dividend) 
Latest dividend: 6 per share ex-dividend date: Jul-17-2026
Risk Adjusted Returns v/s
Returns Beta

News

Newgen Software Technologies Ltd Sees Robust Trading Activity Amid Mixed Market Signals
Newgen Software Technologies Ltd (NEWGEN) emerged as one of the most actively traded stocks by value on 29 Jul 2026, registering a significant 7.65% gain in a session where the broader IT sector advanced 2.44% and the Sensex rose 1.05%. The stock’s strong performance was accompanied by heightened institutional interest and a surge in delivery volumes, signalling robust investor participation despite a recent downgrade in its Mojo Grade from Hold to Sell.
Read full news article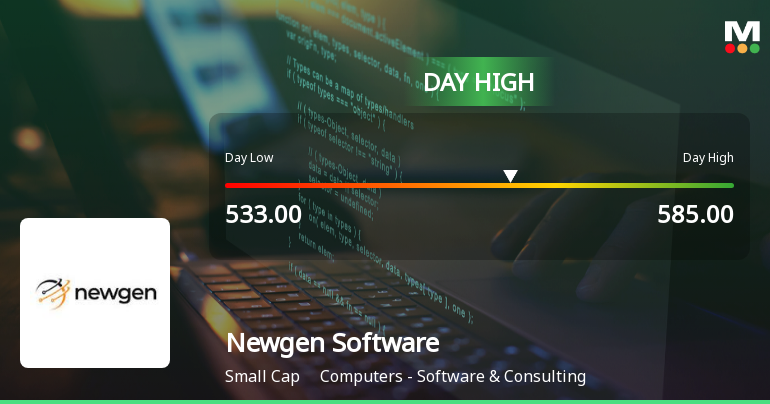
Newgen Software Technologies Ltd Surges 9.5% to Day's High of Rs 561 — Outperforms Sector by 3.49 Percentage Points
The Sensex advanced 0.95% on 29 Jul 2026, yet Newgen Software Technologies Ltd outpaced the broader market with a 9.5% gain, reaching an intraday high of Rs 561. This 3.49 percentage-point outperformance over the IT - Software sector’s 2.34% rise signals a distinctly stock-specific rally rather than a mere market tailwind.
Read full news article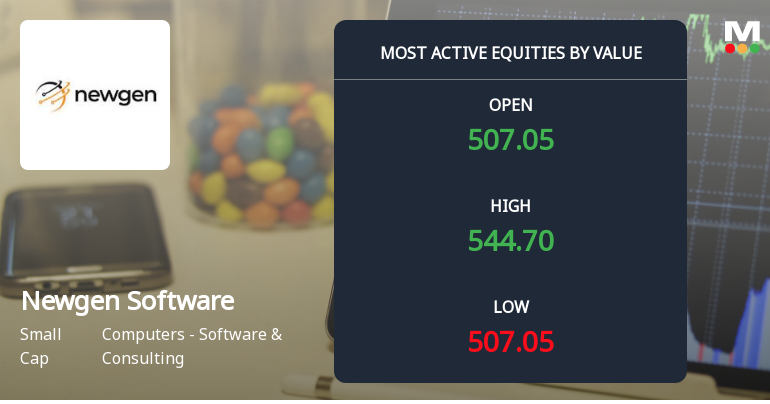
Newgen Software Technologies Ltd Sees Robust Trading Activity Amid Mixed Market Signals
Newgen Software Technologies Ltd emerged as one of the most actively traded stocks by value on 28 July 2026, registering a significant intraday rally and outperforming its sector peers despite a cautious market backdrop. The stock’s strong volume and value turnover, coupled with institutional interest and a recent downgrade in its mojo grade, present a nuanced picture for investors analysing its near-term prospects.
Read full news article Announcements
Newgen Software Technologies Limited - Updates
09-Dec-2019 | Source : NSENewgen Software Technologies Limited has informed the Exchange regarding 'Change of name of Registrar and Share Transfer Agent (RTA) from Karvy Fintech Private Limited to KFIN Technologies Private Limited'.
Newgen Software Technologies Limited - Press Release
28-Nov-2019 | Source : NSENewgen Software Technologies Limited has informed the Exchange regarding a press release dated November 28, 2019, titled "Newgen receives special recognition at Dun & Bradstreet RBL Bank SME Business Excellence Awards 2019".
Newgen Software Technologies Limited - Analysts/Institutional Investor Meet/Con. Call Updates
08-Nov-2019 | Source : NSENewgen Software Technologies Limited has informed the Exchange regarding Analysts/Institutional Investor Meet/Con. Call Updates
Corporate Actions

No Upcoming Board Meetings

Newgen Software Technologies Ltd has declared 60% dividend, ex-date: 17 Jul 26

No Splits history available

Newgen Software Technologies Ltd has announced 1:1 bonus issue, ex-date: 12 Jan 24

No Rights history available
Quality key factors
Valuation key factors
Technicals key factors
 Technical Indicator Scale: Bearish, Mildly Bearish, Sideways, Mildly Bullish, Bullish Turned
 Shareholding Snapshot : Jun 2026
Shareholding Compare (%holding)
Promoters
None
Held by 21 Schemes (2.71%)
Held by 116 FIIs (13.78%)
Tirumalai Sundaraja Iyengar Varadarajan (22.26%)
Marathon Edge India Fund I (5.41%)
19.96%
Quarterly Results Snapshot (Consolidated) - Jun'26 - YoY

YoY Growth in quarter ended Jun 2026 is 11.23% vs 1.89% in Jun 2025
YoY Growth in quarter ended Jun 2026 is 26.35% vs 4.52% in Jun 2025
Half Yearly Results Snapshot (Consolidated) - Sep'25

Growth in half year ended Sep 2025 is 6.74% vs 24.04% in Sep 2024
Growth in half year ended Sep 2025 is 11.50% vs 51.17% in Sep 2024
Nine Monthly Results Snapshot (Consolidated) - Dec'25
YoY Growth in nine months ended Dec 2025 is 6.12% vs 21.69% in Dec 2024
YoY Growth in nine months ended Dec 2025 is -6.10% vs 41.38% in Dec 2024
Annual Results Snapshot (Consolidated) - Mar'26
YoY Growth in year ended Mar 2026 is 5.89% vs 19.54% in Mar 2025
YoY Growth in year ended Mar 2026 is -4.65% vs 25.29% in Mar 2025
About Newgen Software Technologies Ltd

Company Coordinates


