
Key Events This Week
15 Jun: Intraday high surge to Rs.20.39 (+7.17%)
16 Jun: Valuation metrics upgraded to attractive
18 Jun: Technical momentum shifts to sideways trend
19 Jun: Week closes at Rs.19.19 (-1.08% on day)
Bajaj Hindusthan Sugar Ltd Technical Momentum Shifts Amid Mixed Market Signals
2026-06-18 08:02:01Bajaj Hindusthan Sugar Ltd has experienced a notable shift in its technical momentum, moving from a mildly bearish stance to a sideways trend, reflecting a complex interplay of bullish and bearish signals across key technical indicators. Despite a recent downgrade in its Mojo Grade to Sell from Strong Sell, the stock’s mixed technical profile suggests cautious optimism amid ongoing market volatility.
Read full news article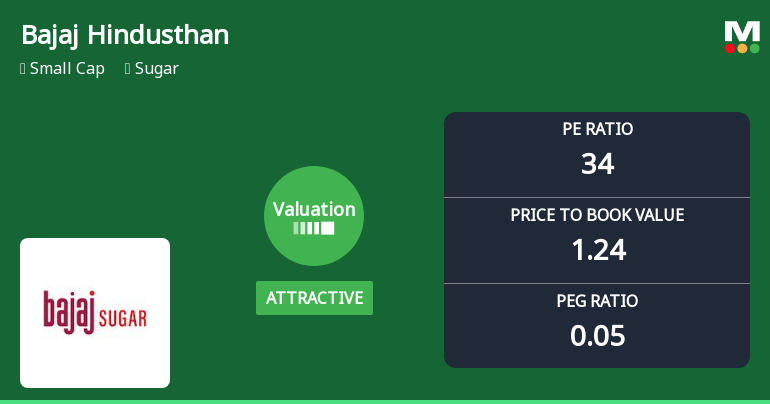
Bajaj Hindusthan Sugar Ltd Valuation Shifts Signal Price Attractiveness
2026-06-16 08:00:49Bajaj Hindusthan Sugar Ltd has witnessed a notable shift in its valuation parameters, moving from a fair to an attractive valuation grade. This change, driven primarily by its price-to-earnings (P/E) and price-to-book value (P/BV) ratios, signals a potential reappraisal of the stock’s price attractiveness amid a challenging sector backdrop and mixed financial metrics.
Read full news article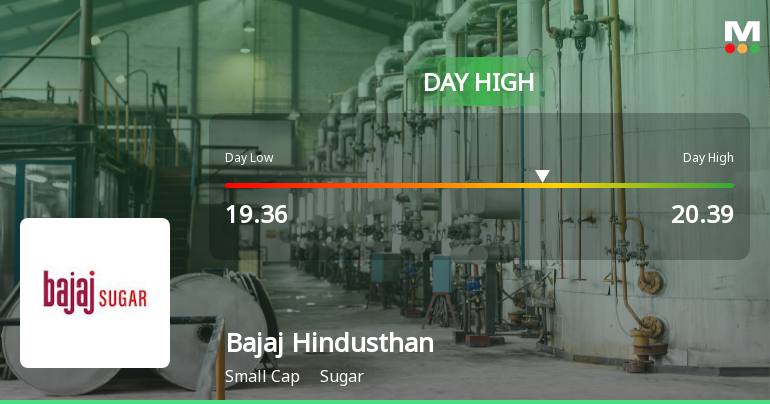
Bajaj Hindusthan Sugar Ltd Surges 7.17% to Day's High of Rs 20.39 — Outperforms Sector by 3 Percentage Points
2026-06-15 11:01:50The Sensex advanced 1.68% on 15 Jun 2026, yet Bajaj Hindusthan Sugar Ltd outpaced both the benchmark and its sector with a robust 7.17% gain, touching an intraday high of Rs 20.39. This 3 percentage-point outperformance over the sugar sector’s 3.71% rise signals a distinctly stock-specific momentum surge.
Read full news article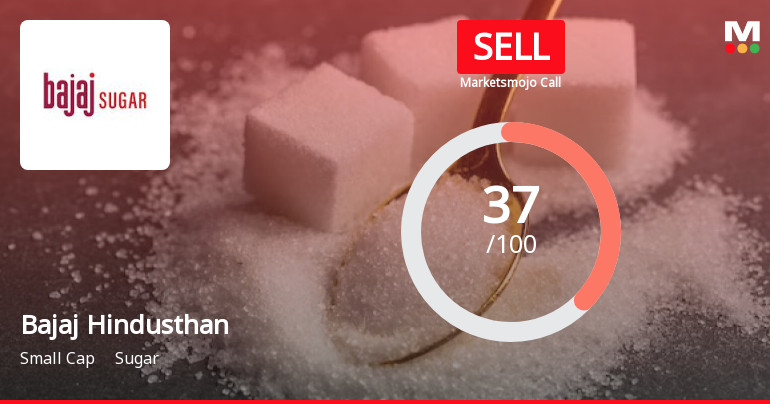
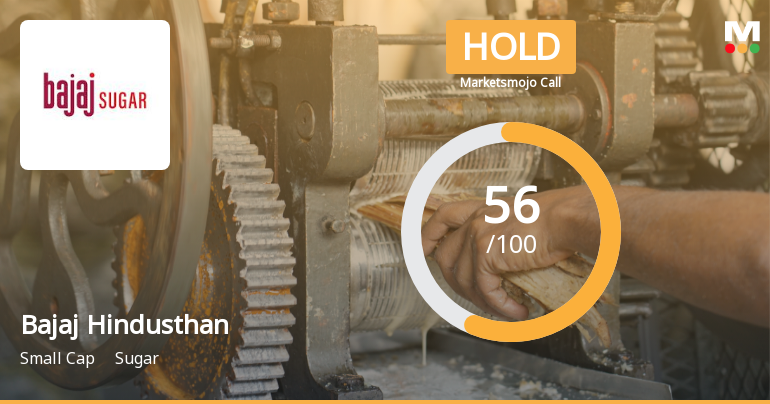
Bajaj Hindusthan Sugar Ltd is Rated Sell
2026-06-14 10:10:29Bajaj Hindusthan Sugar Ltd is rated 'Sell' by MarketsMOJO, with this rating last updated on 30 May 2026. However, the analysis and financial metrics discussed here reflect the stock's current position as of 14 June 2026, providing investors with an up-to-date view of the company’s fundamentals, valuation, financial trends, and technical outlook.
Read full news articleBajaj Hindusthan Sugar Ltd Gains 7.62%: Key Drivers Behind the Weekly Rally
2026-06-14 10:00:07
Key Events This Week
1 June: Significant gap up opening at Rs.19.05 (+3.70%)
2 June: Q4 FY26 results reveal a stellar turnaround but highlight structural weaknesses
2 June: Valuation grade upgraded to attractive with improved P/E and P/BV ratios
5 June: Week closes at Rs.19.77, up 7.62% for the week
Bajaj Hindusthan Sugar Limited - Shareholders meeting
18-Nov-2019 | Source : NSEBajaj Hindusthan Sugar Limited has informed the Exchange regarding Notice of Postal Ballot
Bajaj Hindusthan Sugar Limited - Outcome of Board Meeting
13-Nov-2019 | Source : NSEBajaj Hindusthan Sugar Limited has informed the Exchange regarding Board meeting held on November 13, 2019 in respect of forthcoming Postal Ballot.
Shareholders meeting
20-Sep-2019 | Source : NSE
| Bajaj Hindusthan Sugar Limited has informed the Exchange regarding voting results of Annual General Meeting held on September 20, 2019 |
Corporate Actions

No Upcoming Board Meetings

Bajaj Hindusthan Sugar Ltd has declared 10% dividend, ex-date: 31 Jan 13

No Splits history available

No Bonus history available

Bajaj Hindusthan Sugar Ltd has announced 2:1 rights issue, ex-date: 21 Sep 11


