Key Events This Week
18 May: Shares plunge to lower circuit at Rs.94.90 (-4.96%) amid heavy selling
19 May: Another lower circuit hit at Rs.90.20 (-4.95%) with valuation concerns raised
20 May: Sharp rebound to upper circuit at Rs.94.70 (+4.99%) on strong buying
21 May: Upper circuit again at Rs.99.40 (+4.96%) despite low volumes
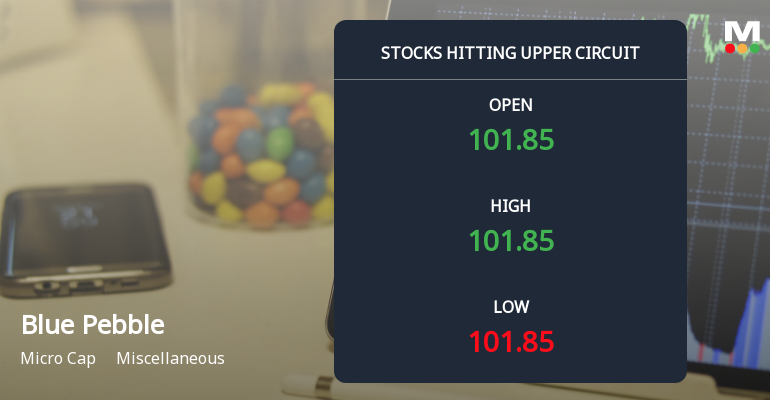
22 May: Week closes with upper circuit at Rs.101.85 (+5.00%) and rising delivery volumes
Read full news article