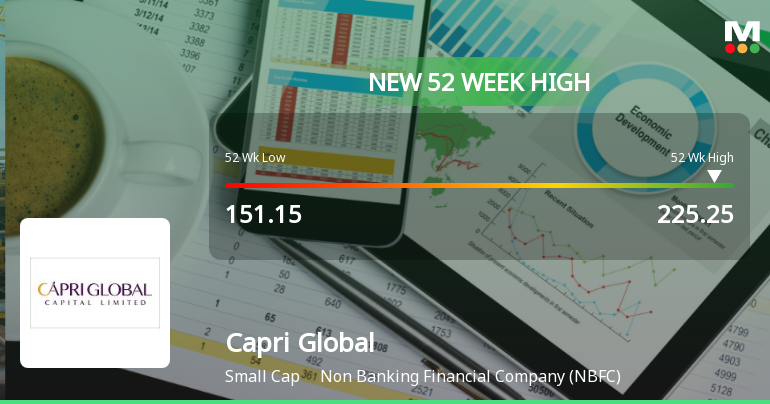
Overview of Recent Price Movements
As of the latest trading session, Capri Global closed at ₹187.10, slightly down from the previous close of ₹188.15. The stock traded within a narrow intraday range, hitting a high of ₹190.55 and a low of ₹187.00. Over the past 52 weeks, the share price has oscillated between ₹150.60 and ₹231.70, indicating a significant volatility band. The current price sits closer to the lower end of this range, suggesting some pressure on the stock in recent months.
Technical Indicators: Mixed Signals Across Timeframes
Examining the technical indicators reveals a nuanced picture. The Moving Average Convergence Divergence (MACD) indicator shows a mildly bearish signal on the weekly chart, while the monthly chart remains bulli...
Read More


