

Key Events This Week
13 Jul: New 52-week and all-time high at Rs.257.5, upper circuit hit
14 Jul: New 52-week and all-time high at Rs.268, upper circuit hit again
15 Jul: New 52-week high at Rs.278.8, rating downgraded from Strong Buy to Buy
16 Jul: Lower circuit hit amid heavy selling, closing at Rs.258.95
17 Jul: Lower circuit hit again, closing at Rs.246.05, financial trend flattens
Are Chembond Chemicals Ltd latest results good or bad?
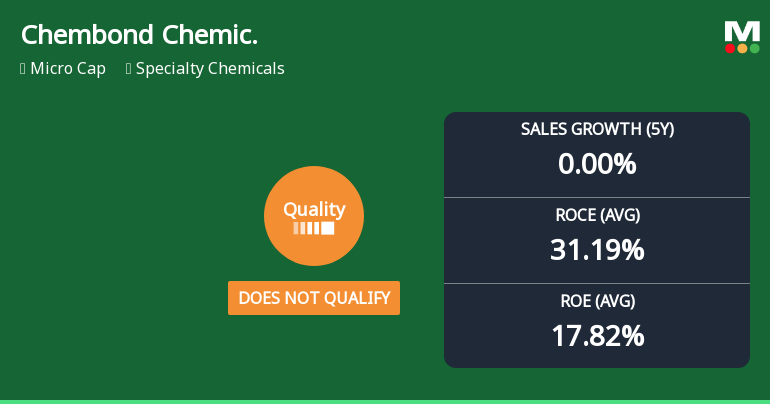
2026-07-17 19:14:52Chembond Chemicals Ltd's latest financial results for Q1 FY27 present a mixed picture. The company reported a net profit of ₹9.53 crores, which reflects a significant year-on-year increase of 52.24%. However, this figure represents an 18.76% decline compared to the previous quarter. Revenue for the same period was ₹86.48 crores, marking a robust year-on-year growth of 32.27%, yet it also showed a sequential decrease of 14.70% from ₹101.38 crores in Q4 FY26. The operating margin, excluding other income, stood at 13.10%, which is a slight year-on-year improvement of 0.22%. Nonetheless, it indicates a notable sequential contraction of 2.56% from the prior quarter's 15.66%. This decline in operating efficiency raises concerns regarding the company's ability to manage costs effectively in the current environment. The company's return on equity (ROE) remains strong at 17.82%, reflecting effective capital utiliz...
Read full news article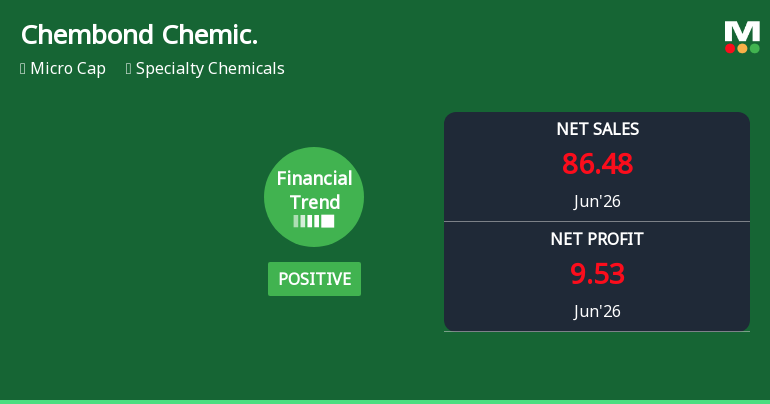
Chembond Chemicals Ltd Reports Flattening Financial Trend Despite Strong Quarterly Growth
2026-07-17 14:00:21Chembond Chemicals Ltd, a micro-cap player in the Specialty Chemicals sector, reported a mixed quarterly performance for June 2026. While the company continues to demonstrate robust top-line growth and strong profit after tax (PAT) expansion, its overall financial trend has moderated from positive to flat, reflecting a cautious outlook amid evolving market dynamics.
Read full news article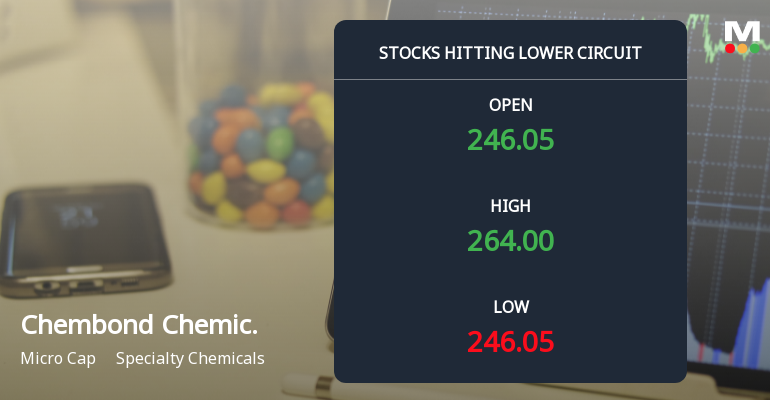
Chembond Chemicals Ltd Locks at Lower Circuit With 5.0% Loss — Sellers Queue, No Buyers in Sight
2026-07-17 10:00:25At Rs 241.55, sellers were still queuing — but there were no buyers willing to take the other side. Chembond Chemicals Ltd locked at its lower circuit of 5.0% on 17 Jul 2026, with unfilled sell orders and a frozen price.
Read full news article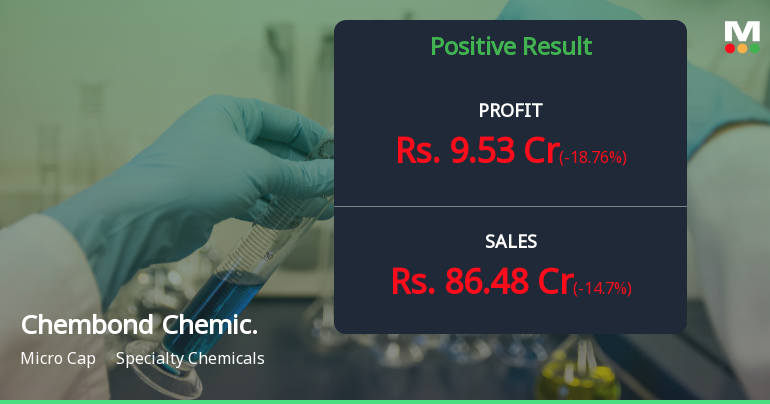
Chembond Chemicals Q1 FY27: Strong Profit Growth Masks Margin Compression Concerns
2026-07-17 09:49:20Chembond Chemicals Ltd., a micro-cap specialty chemicals manufacturer with a market capitalisation of ₹662.00 crores, reported robust consolidated net profit growth of 52.24% year-on-year for Q1 FY27, reaching ₹9.53 crores compared to ₹6.26 crores in the corresponding quarter last year. However, the quarter witnessed a sequential decline of 18.76% from Q4 FY26's ₹11.73 crores, raising questions about sustainability of the growth trajectory. The stock closed at ₹246.05 on July 17, 2026, down 4.98% from the previous session, reflecting investor concerns about margin pressures despite the headline profit growth.
Read full news articleAre Chembond Chemicals Ltd latest results good or bad?
2026-07-16 19:14:58Chembond Chemicals Ltd's latest financial results for the quarter ending March 2026 indicate a notable performance amidst a challenging environment in the specialty chemicals sector. The company's net sales reached ₹101.38 crores, representing a year-on-year growth of 29.96%, which is the highest quarterly revenue recorded in its recent history. This growth is complemented by a significant net profit of ₹11.73 crores, reflecting a year-on-year increase of 33.14%. The profit after tax margin also expanded to 11.47%, up from 11.14% in the same quarter last year, suggesting improved bottom-line efficiency. However, the operating margin experienced a slight contraction to 15.66% from 15.72% in the previous year, indicating some pressure from elevated input costs and competitive pricing in certain product categories. Despite this, Chembond's operational metrics remain strong, with a Return on Capital Employed (...
Read full news article
Chembond Chemicals Ltd Locks at Lower Circuit With 5% Loss — Sellers Queue, No Buyers in Sight
2026-07-16 15:00:10At Rs 249.42, sellers were still queuing — but there were no buyers willing to take the other side. Chembond Chemicals Ltd locked at its lower circuit of 5% on 16 Jul 2026, with unfilled sell orders and a frozen price, signalling a pronounced imbalance in supply and demand on the exchange floor.
Read full news article


