

Dar Credit & Capital Ltd is Rated Sell
2026-06-18 10:10:04Dar Credit & Capital Ltd is rated 'Sell' by MarketsMOJO, with this rating last updated on 05 August 2025. However, the analysis and financial metrics discussed here reflect the stock's current position as of 18 June 2026, providing investors with an up-to-date view of the company’s fundamentals, returns, and market standing.
Read full news article
Dar Credit & Capital Ltd is Rated Sell
2026-05-29 10:10:03Dar Credit & Capital Ltd is rated 'Sell' by MarketsMOJO, with this rating last updated on 05 Aug 2025. However, the analysis and financial metrics discussed here reflect the company’s current position as of 29 May 2026, providing investors with an up-to-date perspective on the stock’s fundamentals, valuation, financial trends, and technical outlook.
Read full news article
Dar Credit & Capital Ltd is Rated Sell
2026-05-18 10:10:03Dar Credit & Capital Ltd is rated 'Sell' by MarketsMOJO, with this rating last updated on 05 Aug 2025. However, the analysis and financial metrics discussed here reflect the company’s current position as of 18 May 2026, providing investors with an up-to-date view of the stock’s fundamentals, valuation, financial trends, and technical outlook.
Read full news article
Dar Credit & Capital Q4 FY26: Strong Quarter Masks Structural Concerns
2026-05-16 16:55:47Dar Credit & Capital Ltd., a micro-cap non-banking financial company (NBFC) with a market capitalisation of ₹60.00 crores, reported its strongest quarterly performance in Q4 FY26 with net profit reaching ₹3.07 crores, marking a sequential gain of 21.83% over Q3 FY26 and a substantial 60.73% year-on-year surge. Despite the impressive quarterly numbers, the stock has struggled significantly, declining 25.18% over the past six months and trading 36.52% below its 52-week high of ₹66.00, reflecting persistent investor concerns about the company's modest scale, weak return on equity, and technical deterioration.
Read full news article
Dar Credit & Capital Ltd is Rated Sell
2026-05-06 10:10:21Dar Credit & Capital Ltd is rated 'Sell' by MarketsMOJO, with this rating last updated on 05 Aug 2025. However, the analysis and financial metrics discussed here reflect the stock's current position as of 06 May 2026, providing investors with an up-to-date view of the company's fundamentals, returns, and market standing.
Read full news article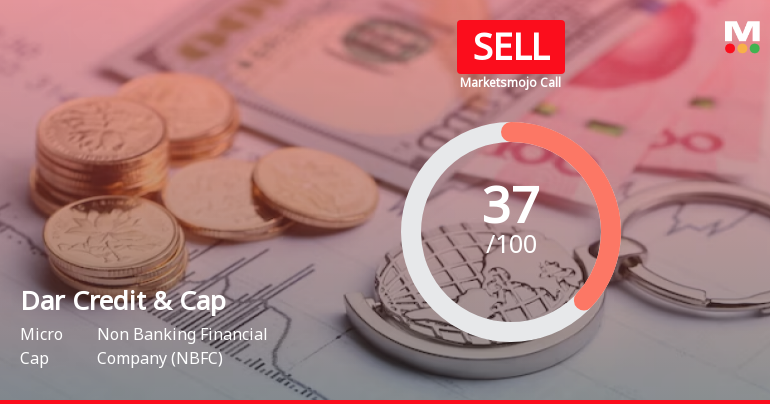
Dar Credit & Capital Ltd is Rated Sell
2026-04-24 10:10:03Dar Credit & Capital Ltd is rated 'Sell' by MarketsMOJO, with this rating last updated on 05 Aug 2025. However, the analysis and financial metrics discussed here reflect the stock's current position as of 24 April 2026, providing investors with an up-to-date view of the company’s fundamentals, valuation, financial trends, and technical outlook.
Read full news article
Dar Credit & Capital Ltd is Rated Sell
2026-04-13 10:10:14Dar Credit & Capital Ltd is rated 'Sell' by MarketsMOJO, with this rating last updated on 05 August 2025. However, the analysis and financial metrics discussed here reflect the stock's current position as of 13 April 2026, providing investors with an up-to-date perspective on the company’s fundamentals, valuation, financial trends, and technical outlook.
Read full news article
Dar Credit & Capital Ltd is Rated Sell
2026-04-02 10:10:03Dar Credit & Capital Ltd is rated 'Sell' by MarketsMOJO. This rating was last updated on 05 Aug 2025, reflecting a shift from a previous 'Strong Sell' stance. However, all fundamentals, returns, and financial metrics discussed here are current as of 02 April 2026, providing investors with an up-to-date view of the stock's position.
Read full news article
Corporate Actions

No Upcoming Board Meetings

Dar Credit & Capital Ltd has declared 5% dividend, ex-date: 23 Jun 26

No Splits history available

No Bonus history available

No Rights history available


