Eternal

  • Market Cap: Large Cap
  • Industry: E-Retail/ E-Commerce
  • ISIN: INE758T01015
  • NSEID: ETERNAL
  • BSEID: 543320
INR
315.00
-1.25 (-0.4%)
BSENSE

Aug 07, 03:30 PM

BSE+NSE Vol: 1.36 cr

  • Price Points
  • Score
  • Mojo Parameters
  • Total Return
  • News and Corporate Actions
  • Key factors
  • Shareholding
  • Financials
  • CompanyCV
{
  "main_header": {
    "sid": 1003511,
    "name": "Eternal",
    "stock_name": "Eternal",
    "full_name": "Eternal Ltd",
    "name_url": "stocks-analysis/eternal",
    "exchange": 1,
    "exchangecode": "",
    "primexch": 1,
    "country_id": 34,
    "currency": "INR",
    "cmp": "315.00",
    "chg": -1.25,
    "chgp": "-0.4%",
    "dir": -1,
    "prev_price": "316.25",
    "mcapval": "303,311.00 Cr",
    "mcap": "Large Cap",
    "scripcode": 543320,
    "symbol": "ETERNAL",
    "ind_name": "E-Retail/ E-Commerce",
    "ind_code": 57,
    "sector_id": 24,
    "indexname": "India SENSEX",
    "isin": "INE758T01015",
    "curr_date": "Aug 07, 03:30 PM",
    "curr_time": "01:57 AM",
    "last_traded_at": "Aug 07, 03:30 PM IST",
    "bse_nse_vol": "1.36 cr",
    "exc_status": "Active",
    "traded_date": "Aug 07, 2026",
    "traded_date_str": "2026 08 07",
    "score": "",
    "scoreText": "",
    "Live": 0,
    "market_time": 0,
    "is_blur": 1,
    "is_blur_class": "blur-registerF-score-header",
    "is_blur_url": "https://www.marketsmojo.com/mojofeed/register?redirect=/stocks-analysis/eternal-1003511-1&utm_source=Spage_Header_Score",
    "mojoone": {
      "ismore": 0
    }
  },
  "news": {
    "results": [
      {
        "title": "Eternal Ltd is Rated Sell by MarketsMOJO",
        "link": "https://www.marketsmojo.com/news/stock-recommendation/eternal-ltd-is-rated-sell-by-marketsmojo-4144016",
        "imagepath": "https://i.marketsmojo.com/newsimg/2026/8/EternalLtd_mojoScore_4144016.png",
        "date": "2026-08-09 10:10:28",
        "description": "Eternal Ltd is currently rated Sell by MarketsMOJO, with this rating last updated on 03 August 2026. While the rating change occurred on that date, the analysis and financial metrics discussed here reflect the stock’s present position as of 09 August 2026, providing investors with the most up-to-date perspective on the company’s performance and outlook."
      },
      {
        "title": "Eternal Ltd Gains 4.33%: 4 Key Technical Shifts Shape Weekly Momentum",
        "link": "https://www.marketsmojo.com/news/stocks-in-action/eternal-ltd-gains-433-4-key-technical-shifts-shape-weekly-momentum-4143077",
        "imagepath": "",
        "date": "2026-08-08 12:02:38",
        "description": "    <div class=\"article-news-new\">\n        <div class=\"article-container\">\n\n<div class=\"article-content\">\n                <div class=\"highlight-box\">\n                    <h3>Key Events This Week</h3>\n                    <p><strong>3 Aug:</strong> Stock opens strong at Rs.310.00, gaining 2.53%</p>\n                    <p><strong>4 Aug:</strong> Technical momentum shifts amid mixed indicator signals</p>\n                    <p><strong>6 Aug:</strong> Golden Cross formation signals potential bullish breakout</p>\n                    <p><strong>6 Aug:</strong> Robust trading activity despite Mojo Grade downgrade</p>\n                    <p><strong>7 Aug:</strong> Technical momentum shifts to bullish stance, stock closes at Rs.315.45</p>\n                </div>\n\n                <div class=\"stats-row\">\n                    <div class=\"stat-item\"><div class=\"stat-label\">Week Open</div><div class=\"stat-value\">Rs.302.35</..."
      },
      {
        "title": "Eternal Ltd Technical Momentum Shift Signals Bullish Outlook Amid Mixed Indicators",
        "link": "https://www.marketsmojo.com/news/stocks-in-action/eternal-ltd-technical-momentum-shift-signals-bullish-outlook-amid-mixed-indicators-4141071",
        "imagepath": "https://i.marketsmojo.com/newsimg/2026/8/EternalLtd_technicaldot_4141071.png",
        "date": "2026-08-07 08:06:02",
        "description": "Eternal Ltd, a prominent player in the E-Retail and E-Commerce sector, has exhibited a notable shift in its technical momentum, transitioning from a sideways trend to a bullish stance. This change is underscored by a combination of technical indicators including MACD, RSI, moving averages, and Bollinger Bands, which collectively suggest an improving price momentum despite some mixed signals on longer-term charts. The stock’s recent performance outpaces the broader market, reflecting renewed investor interest and potential for further gains."
      },
      {
        "title": "Golden Cross Confirmed: Do Eternal Ltd's Other Technical Indicators Agree?",
        "link": "https://www.marketsmojo.com/news/stocks-in-action/eternal-ltd-forms-golden-cross-signalling-potential-bullish-breakout-4140320",
        "imagepath": "https://i.marketsmojo.com/newsimg/2026/8/EternalLtd_goldencross_4140320.png",
        "date": "2026-08-06 18:00:38",
        "description": "The 50-day moving average has crossed above the 200-day moving average for Eternal Ltd, signalling a golden cross on 6 Aug 2026. While this technical event often suggests a shift towards bullish momentum, the broader technical and fundamental context presents a more nuanced picture that warrants closer examination."
      },
      {
        "title": "Eternal Ltd Sees Robust Trading Activity Amid Upgraded Sell Rating",
        "link": "https://www.marketsmojo.com/news/stocks-in-action/eternal-ltd-sees-robust-trading-activity-amid-upgraded-sell-rating-4140068",
        "imagepath": "https://i.marketsmojo.com/newsimg/2026/8/EternalLtd_most_active_equities_by_value_4140068.png",
        "date": "2026-08-06 11:00:08",
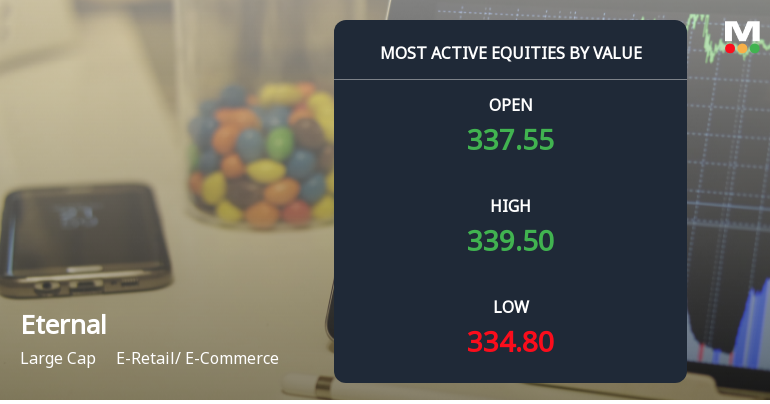
        "description": "Eternal Ltd, a large-cap player in the E-Retail and E-Commerce sector, witnessed significant trading activity on 6 August 2026, with its shares outperforming the sector and broader market indices despite a recent downgrade in its Mojo Grade from Hold to Sell. The stock recorded a strong value turnover of ₹334.61 crores on heavy volumes, reflecting heightened investor interest amid mixed signals on fundamentals and momentum."
      },
      {
        "title": "P/E at 692.69 vs Industry's 21.57: What the Data Shows for Eternal Ltd",
        "link": "https://www.marketsmojo.com/news/stocks-in-action/eternal-ltds-nifty-50-membership-highlights-institutional-shifts-and-market-impact-4139472",
        "imagepath": "",
        "date": "2026-08-06 09:21:32",
        "description": "    <div class=\"article-news-new\">\n        <div class=\"article-container\">\n\n<div class=\"article-content\">\n                <p><strong>Significance of Nifty 50 Membership for Eternal Ltd</strong></p>\n                <p>Being part of the Nifty 50 index confers considerable prestige and market attention on Eternal Ltd, which boasts a market capitalisation of ₹3,02,393.74 crores. This inclusion not only enhances the stock’s visibility among domestic and global investors but also ensures its weighting in numerous index-tracking funds and ETFs. Consequently, the company benefits from increased liquidity and a more stable investor base, which can mitigate volatility during broader market swings.</p>\n                <p>However, the company’s current valuation metrics warrant scrutiny. Eternal Ltd’s price-to-earnings (P/E) ratio stands at an elevated 692.69, starkly contrasting with the industry average of 21.57. Thi..."
      },
      {
        "title": "P/E at 692.69 vs Industry's 21.61: What the Data Shows for Eternal Ltd",
        "link": "https://www.marketsmojo.com/news/stocks-in-action/eternal-ltds-nifty-50-membership-reinforces-market-standing-amid-mixed-institutional-sentiment-4137412",
        "imagepath": "",
        "date": "2026-08-05 09:20:58",
        "description": "    <div class=\"article-news-new\">\n        <div class=\"article-container\">\n\n<div class=\"article-content\">\n                <p><strong>Valuation Picture: A Premium That Demands Scrutiny</strong></p>\n                <p>The valuation premium of <a href=\"https://www.marketsmojo.com/stocks-analysis/eternal-1003511-0\" class=\"stk\">Eternal Ltd</a> is extraordinary. At a P/E of 692.69, the stock is priced at more than 32 times the sector’s average of 21.61, a gap that is rarely seen in large-cap stocks within the E-Retail/ E-Commerce sector. Such a premium typically implies expectations of exceptional growth or profitability, yet the current data suggests a more nuanced reality. The industry P/E reflects a sector characterised by moderate valuations, making Eternal’s elevated multiple a significant outlier. This disparity raises questions about the sustainability of the premium — <a href=\"https://www.marketsmojo.com/..."
      },
      {
        "title": "Eternal Ltd Technical Momentum Shifts Amid Mixed Indicator Signals",
        "link": "https://www.marketsmojo.com/news/stocks-in-action/eternal-ltd-technical-momentum-shifts-amid-mixed-indicator-signals-4135375",
        "imagepath": "https://i.marketsmojo.com/newsimg/2026/8/EternalLtd_technicaldot_4135375.png",
        "date": "2026-08-04 08:10:19",
        "description": "Eternal Ltd, a large-cap player in the E-Retail and E-Commerce sector, has experienced a notable shift in its technical momentum, moving from a mildly bullish stance to a sideways trend. Despite a 2.53% gain on 4 Aug 2026, the company’s technical indicators present a complex picture, with bullish signals on weekly MACD and Bollinger Bands contrasting with mildly bearish monthly trends and daily moving averages. This article analyses these technical parameters in detail, alongside the company’s recent price performance relative to the Sensex benchmark."
      },
      {
        "title": "P/E at 673.85 vs Industry's 21.10: What the Data Shows for Eternal Ltd",
        "link": "https://www.marketsmojo.com/news/stocks-in-action/eternal-ltd-strengthens-position-as-nifty-50-constituent-amid-institutional-interest-4133130",
        "imagepath": "",
        "date": "2026-08-03 09:21:07",
        "description": "    <div class=\"article-news-new\">\n        <div class=\"article-container\">\n\n<div class=\"article-content\">\n                <p><strong>Valuation Picture: A Premium That Demands Scrutiny</strong></p>\n                <p>The current P/E ratio of <a href=\"https://www.marketsmojo.com/stocks-analysis/eternal-1003511-0\" class=\"stk\">Eternal Ltd</a> at 673.85 is exceptionally elevated compared to the sector’s 21.10. Such a premium typically signals either expectations of extraordinary growth or a stretched valuation that may not be justified by fundamentals. This disparity is one of the highest recorded in the E-Retail/ E-Commerce sector in recent years, suggesting investors are pricing in significant future earnings expansion or other qualitative factors. However, the premium also implies heightened risk, especially if earnings growth fails to meet lofty expectations — <a href=\"https://www.marketsmojo.com/stocks-anal..."
      }
    ],
    "total": 1677,
    "sid": "1003511",
    "stock_news_url": "https://www.marketsmojo.com/news/eternal-1003511"
  },
  "announcements": "",
  "corporate_actions": [
    {
      "img": "board-meeting.svg",
      "title": "BOARD MEETING",
      "msg": "<span>No</span> Upcoming Board Meetings",
      "data": []
    },
    {
      "img": "dividend.svg",
      "title": "DIVIDEND",
      "msg": "No <strong>Dividend</strong> history available",
      "data": []
    },
    {
      "img": "splits.svg",
      "title": "SPLITS",
      "msg": "No <strong>Splits</strong> history available",
      "data": []
    },
    {
      "img": "bonus.svg",
      "title": "BONUS",
      "msg": "No <strong>Bonus</strong> history available",
      "data": []
    },
    {
      "img": "rights-issues.svg",
      "title": "RIGHTS",
      "msg": "No <strong>Rights</strong> history available",
      "data": []
    }
  ]
}
stock newsNews and Views

Eternal Ltd Gains 4.33%: 4 Key Technical Shifts Shape Weekly Momentum

2026-08-08 12:02:38

Key Events This Week

3 Aug: Stock opens strong at Rs.310.00, gaining 2.53%

4 Aug: Technical momentum shifts amid mixed indicator signals

6 Aug: Golden Cross formation signals potential bullish breakout

6 Aug: Robust trading activity despite Mojo Grade downgrade

7 Aug: Technical momentum shifts to bullish stance, stock closes at Rs.315.45

P/E at 692.69 vs Industry's 21.57: What the Data Shows for Eternal Ltd

2026-08-06 09:21:32

Significance of Nifty 50 Membership for Eternal Ltd

Being part of the Nifty 50 index confers considerable prestige and market attention on Eternal Ltd, which boasts a market capitalisation of ₹3,02,393.74 crores. This inclusion not only enhances the stock’s visibility among domestic and global investors but also ensures its weighting in numerous index-tracking funds and ETFs. Consequently, the company benefits from increased liquidity and a more stable investor base, which can mitigate volatility during broader market swings.

However, the company’s current valuation metrics warrant scrutiny. Eternal Ltd’s price-to-earnings (P/E) ratio stands at an elevated 692.69, starkly contrasting with the industry average of 21.57. Thi...

Read full news article

P/E at 692.69 vs Industry's 21.61: What the Data Shows for Eternal Ltd

2026-08-05 09:20:58

Valuation Picture: A Premium That Demands Scrutiny

The valuation premium of Eternal Ltd is extraordinary. At a P/E of 692.69, the stock is priced at more than 32 times the sector’s average of 21.61, a gap that is rarely seen in large-cap stocks within the E-Retail/ E-Commerce sector. Such a premium typically implies expectations of exceptional growth or profitability, yet the current data suggests a more nuanced reality. The industry P/E reflects a sector characterised by moderate valuations, making Eternal’s elevated multiple a significant outlier. This disparity raises questions about the sustainability of the premium — Read full news article

P/E at 673.85 vs Industry's 21.10: What the Data Shows for Eternal Ltd

2026-08-03 09:21:07

Valuation Picture: A Premium That Demands Scrutiny

The current P/E ratio of Eternal Ltd at 673.85 is exceptionally elevated compared to the sector’s 21.10. Such a premium typically signals either expectations of extraordinary growth or a stretched valuation that may not be justified by fundamentals. This disparity is one of the highest recorded in the E-Retail/ E-Commerce sector in recent years, suggesting investors are pricing in significant future earnings expansion or other qualitative factors. However, the premium also implies heightened risk, especially if earnings growth fails to meet lofty expectations — Read full news article

stock-recommendationAnnouncement
Icon
No announcement available
stock-recommendationCorporate Actions
Corporate Actions
info
stock-summary
BOARD MEETING

No Upcoming Board Meetings

stock-summary
DIVIDEND

No Dividend history available

stock-summary
SPLITS

No Splits history available

stock-summary
BONUS

No Bonus history available

stock-summary
RIGHTS

No Rights history available