
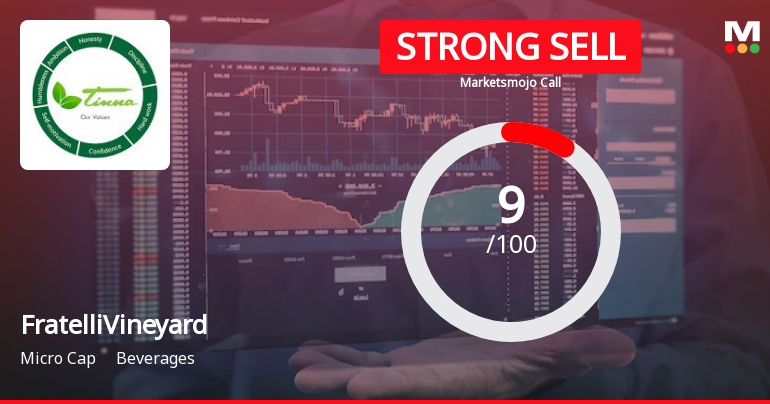
Fratelli Vineyards Ltd is Rated Strong Sell
2026-06-10 10:10:47Fratelli Vineyards Ltd is rated Strong Sell by MarketsMOJO, with this rating last updated on 15 Jan 2025. However, the analysis and financial metrics discussed here reflect the company’s current position as of 10 June 2026, providing investors with an up-to-date perspective on the stock’s fundamentals, valuation, financial trends, and technical outlook.
Read full news articleAre Fratelli Vineyards Ltd latest results good or bad?
2026-06-01 19:29:41Fratelli Vineyards Ltd's latest financial results indicate a company grappling with significant operational challenges. In the fourth quarter of FY26, the company reported net sales of ₹35.30 crores, which reflects a year-on-year increase of 10.59%. However, this figure represents a substantial quarter-on-quarter decline of 44.50% from the previous quarter's sales of ₹63.60 crores. This volatility in revenue raises concerns about the company's ability to maintain consistent sales performance. The net loss for the quarter was ₹7.05 crores, marking a year-on-year deterioration of 35.62% and a quarter-on-quarter increase in losses of 19.15%. This marks the seventh consecutive quarter of losses for the company, accumulating a total of ₹24.90 crores in losses over the past four quarters. The operating margin for Q4 FY26 stood at -14.16%, indicating ongoing profitability issues despite a slight improvement from ...
Read full news article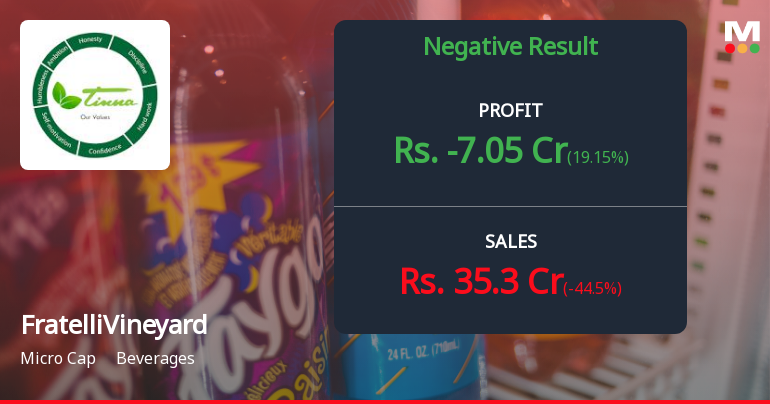
Fratelli Vineyards Q4 FY26: Mounting Losses Deepen as Operational Crisis Intensifies
2026-06-01 12:25:37Fratelli Vineyards Limited, a micro-cap beverage company with a market capitalisation of ₹358.00 crores, reported deeply troubling Q4 FY26 results that underscore an intensifying operational crisis. The company posted a net loss of ₹7.05 crores for the March 2026 quarter, marking a 35.62% year-on-year deterioration from the ₹10.95 crore loss in Q4 FY25. Following the results announcement, the stock plunged 5.00% to ₹82.29, extending a brutal 41.64% decline over the past year and trading 49.14% below its 52-week high of ₹161.80.
Read full news article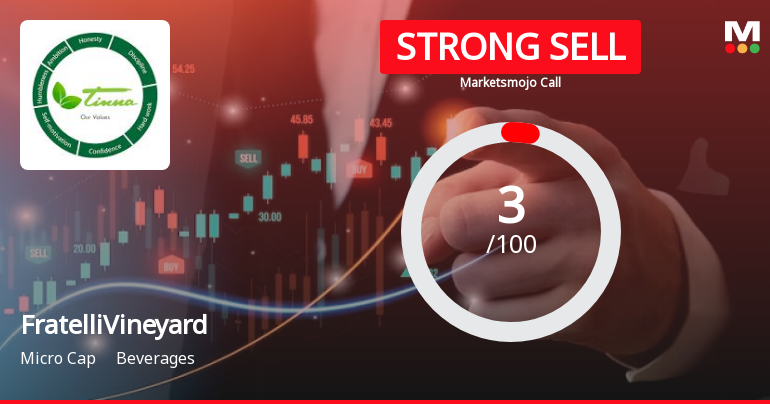
Fratelli Vineyards Ltd is Rated Strong Sell
2026-05-27 10:11:05Fratelli Vineyards Ltd is rated Strong Sell by MarketsMOJO. This rating was last updated on 15 Jan 2025, reflecting a significant reassessment of the stock’s outlook. However, the analysis and financial metrics discussed below represent the company’s current position as of 27 May 2026, providing investors with an up-to-date view of its performance and prospects.
Read full news article
Fratelli Vineyards Ltd is Rated Strong Sell
2026-05-16 10:10:15Fratelli Vineyards Ltd is rated Strong Sell by MarketsMOJO, with this rating last updated on 15 Jan 2025. However, the analysis and financial metrics discussed here reflect the company’s current position as of 16 May 2026, providing investors with an up-to-date view of the stock’s fundamentals, valuation, financial trend, and technical outlook.
Read full news article
Fratelli Vineyards Ltd is Rated Strong Sell
2026-05-05 10:10:17Fratelli Vineyards Ltd is rated Strong Sell by MarketsMOJO, with this rating last updated on 15 Jan 2025. However, the analysis and financial metrics discussed here reflect the company’s current position as of 05 May 2026, providing investors with an up-to-date view of the stock’s fundamentals, valuation, financial trends, and technical outlook.
Read full news article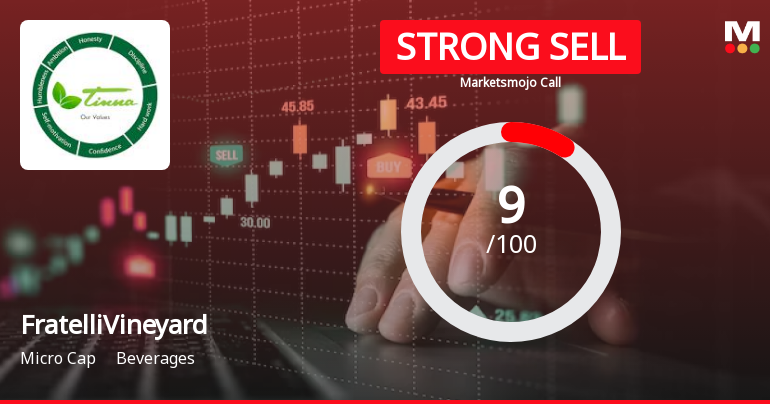
Fratelli Vineyards Ltd is Rated Strong Sell
2026-04-24 10:10:16Fratelli Vineyards Ltd is rated Strong Sell by MarketsMOJO, with this rating last updated on 15 Jan 2025. However, the analysis and financial metrics discussed here reflect the stock's current position as of 24 April 2026, providing investors with an up-to-date view of the company’s fundamentals, valuation, financial trends, and technical outlook.
Read full news article
Fratelli Vineyards Ltd is Rated Strong Sell
2026-04-13 10:10:14Fratelli Vineyards Ltd is rated Strong Sell by MarketsMOJO, with this rating last updated on 15 Jan 2025. However, the analysis and financial metrics discussed here reflect the company’s current position as of 13 April 2026, providing investors with an up-to-date view of its performance and outlook.
Read full news article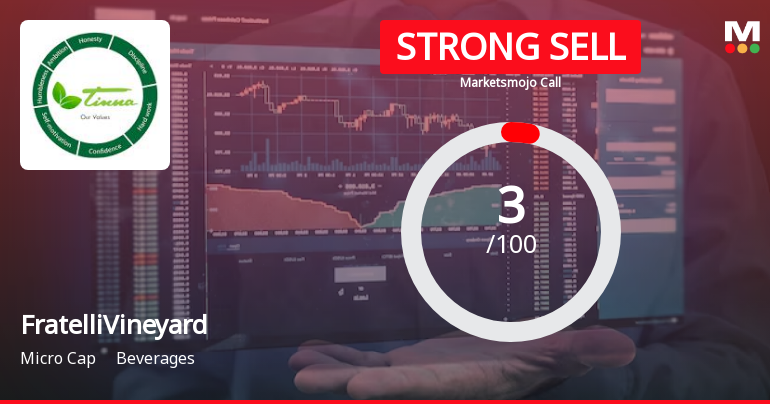
Fratelli Vineyards Ltd is Rated Strong Sell
2026-04-02 10:10:16Fratelli Vineyards Ltd is rated Strong Sell by MarketsMOJO, with this rating last updated on 15 Jan 2025. However, the analysis and financial metrics discussed here reflect the company’s current position as of 02 April 2026, providing investors with the latest insights into its performance and outlook.
Read full news articleAnnouncement under Regulation 30 (LODR)-Earnings Call Transcript
04-Jun-2026 | Source : BSEWe are enclosing herewith transcript of the earning concall held on Tuesday 2nd June 2026.
Announcement under Regulation 30 (LODR)-Newspaper Publication
03-Jun-2026 | Source : BSEPlease find enclosed copies of Newspaper publications confirming completion of dispatch of postal ballot notice.
Announcement under Regulation 30 (LODR)-Analyst / Investor Meet - Outcome
02-Jun-2026 | Source : BSEPursuant to Regulation 30 of SEBI (Listing Obligations and Disclosure Requirements) Regulations 2015 this is to inform that the audio recording of Fratelli Vineyards Limited [earlier known as Tinna Trade Limited] (the Company) earnings call held on Tuesday June 02 2026 at 04:00 PM to discuss the Audited Financial Results and operational performance of the Company for the fourth quarter and financial year ended on March 31 2026 (Q4/FY 2025-26) is available at website of the Company
Corporate Actions

No Upcoming Board Meetings

No Dividend history available

No Splits history available

No Bonus history available

No Rights history available


