Key Events This Week
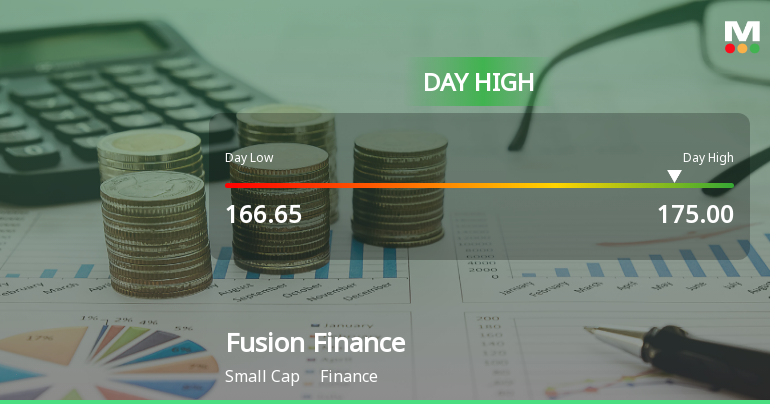
22 Jun: Stock opened at Rs.178.10, down 0.64% amid Sensex gains
23 Jun: Continued decline to Rs.176.35, Sensex fell 1.05%
24 Jun: Rebound with 2.75% gain to Rs.181.20, Sensex up 0.53%
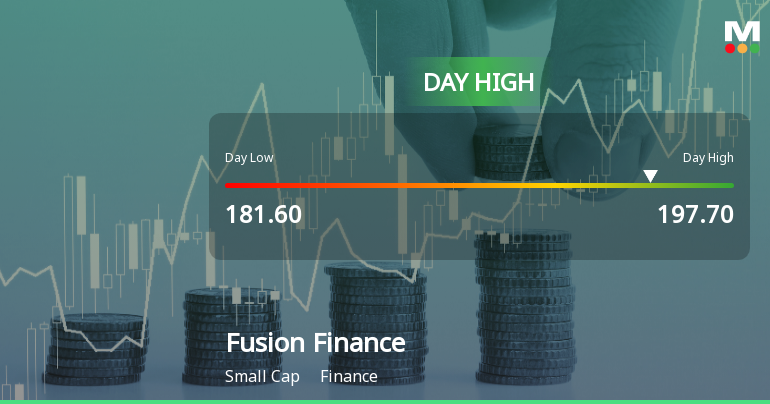
25 Jun: Intraday high surge of 8.2%, closing at Rs.192.90
26 Jun: Markets closed, no trading data available
Week Open
Rs.179.25