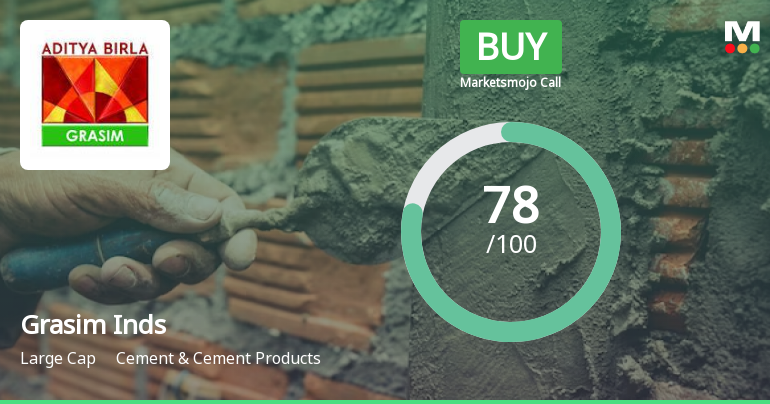
Valuation Picture: Premium Reflecting Market Confidence or Overextension?
Grasim Industries Ltd trades at a P/E multiple of 41.24, which is approximately 23.4% higher than the Cement & Cement Products sector average of 33.42. This premium suggests that investors are pricing in stronger earnings growth or superior business fundamentals relative to peers. However, such a valuation also raises the bar for future performance, as the stock must justify this premium through consistent earnings delivery. The sector’s average P/E reflects a broad range of companies, many of which have reported flat or negative results recently, making Read full news article