
Key Events This Week
8 June: Intraday low hit amid heavy price pressure, stock falls 9.71%
12 June: Formation of Golden Cross, signalling potential bullish breakout
12 June: Week closes at Rs.585.15, down 11.74%
Jun 19, 03:30 PM
BSE+NSE Vol: 1.32 lacs
India Tourism Development Corporation Ltd (ITDC) has witnessed a notable shift in its technical momentum, moving from a mildly bullish stance to a more confident bullish trend. This change is underscored by improvements in key technical indicators such as MACD, Bollinger Bands, and moving averages, signalling renewed investor interest in the small-cap Hotels & Resorts player.
Read full news article
India Tourism Development Corporation Ltd (ITDC) has seen its investment rating upgraded from Sell to Hold, reflecting a nuanced improvement across technical indicators and valuation metrics despite flat financial results in the latest quarter. This reassessment comes amid a mildly bullish technical trend and a premium valuation that investors should carefully consider in the context of the company’s long-term performance and sector dynamics.
Read full news article
India Tourism Development Corporation Ltd (ITDC), a small-cap player in the Hotels & Resorts sector, has recently exhibited a notable shift in its technical momentum, moving from a sideways trend to a mildly bullish stance. This change is underscored by a blend of bullish and bearish signals across key technical indicators, reflecting a nuanced market sentiment as the stock navigates current price levels around ₹585.
Read full news article
8 June: Intraday low hit amid heavy price pressure, stock falls 9.71%
12 June: Formation of Golden Cross, signalling potential bullish breakout
12 June: Week closes at Rs.585.15, down 11.74%
The 50-day moving average has crossed above the 200-day moving average for India Tourism Development Corporation Ltd, signalling a golden cross on 12 Jun 2026. Yet, the broader technical picture is mixed, with weekly indicators showing strength but monthly momentum lagging behind — does this divergence undermine the reliability of the crossover?
Read full news article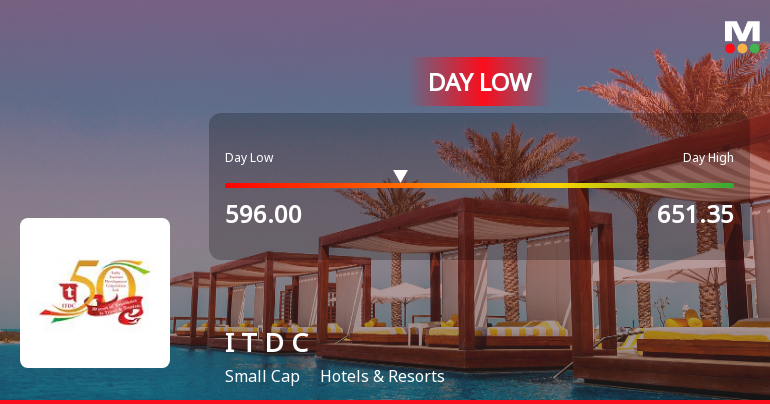
India Tourism Development Corporation Ltd (ITDC) experienced a notable decline today, touching an intraday low of Rs 596, reflecting significant price pressure amid broader market weakness and sectoral underperformance.
Read full news article
India Tourism Development Corporation Ltd is rated 'Sell' by MarketsMOJO, with this rating last updated on 09 Feb 2026. However, the analysis and financial metrics discussed here reflect the stock's current position as of 08 June 2026, providing investors with an up-to-date view of the company’s fundamentals, valuation, financial trends, and technical outlook.
Read full news article
The Sensex declined by 0.25% on 4 Jun 2026, while India Tourism Development Corporation Ltd surged 8.4%, marking a remarkable 9.27-percentage-point outperformance over its Hotels & Resorts sector. This sharp single-session gain rewrites the short-term narrative for the stock, which has been navigating a mixed performance trajectory in recent months.
Read full news article
India Tourism Development Corporation Ltd is rated 'Sell' by MarketsMOJO, with this rating last updated on 09 Feb 2026. However, the analysis and financial metrics discussed here reflect the stock's current position as of 28 May 2026, providing investors with an up-to-date view of its fundamentals, returns, and market performance.
Read full news articleThe appointment of Sh. Malay Kumar Singha as Non-Executive Independent Director is effective from 18.06.2026
Revised Annual Secretarial Compliance Report for the Financial year ended 31.03.2026 since cover letter was missing from the original filing
Annual Secretarial Compliance Report for year ended 31st March 2026

No Upcoming Board Meetings

India Tourism Development Corporation Ltd has declared 29% dividend, ex-date: 09 Sep 25

No Splits history available

No Bonus history available

No Rights history available


