
Key Events This Week
15 Jun: Upgrade to Sell rating on technical improvements despite financial challenges
15 Jun: Mixed technical signals with mildly bullish momentum observed
19 Jun: Week closes at Rs.220.65, down 0.72% for the week versus Sensex +2.35%

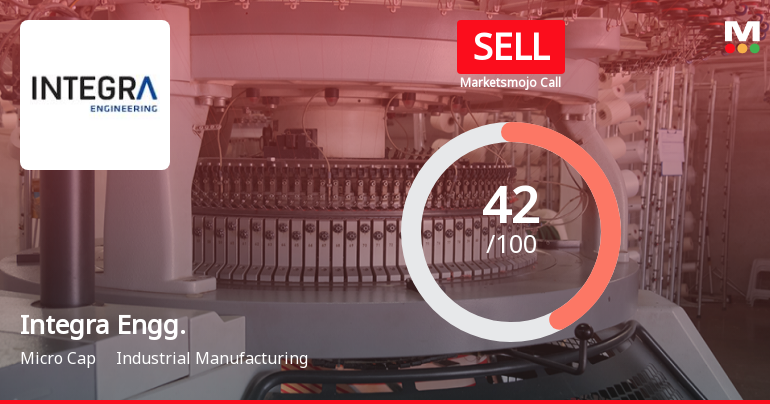
Integra Engineering India Ltd Upgraded to Sell on Technical Improvements Despite Financial Challenges
2026-06-15 08:03:02Integra Engineering India Ltd has seen its investment rating upgraded from Strong Sell to Sell as of 12 June 2026, driven primarily by a shift in technical indicators despite ongoing financial headwinds. The micro-cap industrial manufacturing company’s technical outlook has improved to mildly bullish, prompting a reassessment of its market stance, even as valuation and financial trends remain challenging.
Read full news article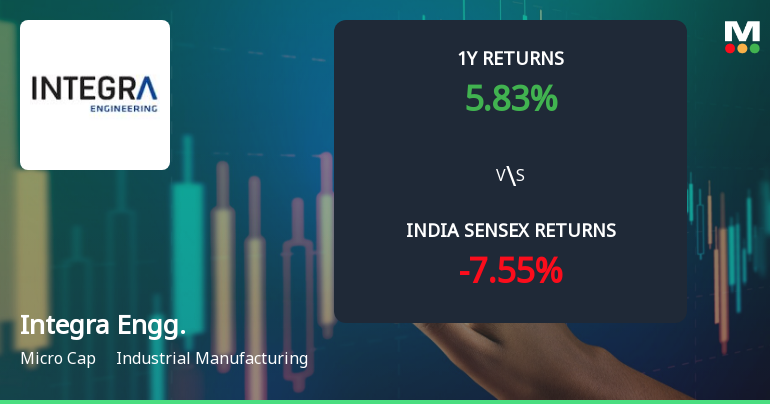
Integra Engineering India Ltd Shows Mixed Technical Signals Amid Mildly Bullish Momentum
2026-06-15 08:00:46Integra Engineering India Ltd, a micro-cap player in the industrial manufacturing sector, has recently exhibited a shift in technical momentum from mildly bearish to mildly bullish. Despite a modest day gain of 1.02%, the stock’s technical indicators present a nuanced picture, with some signals pointing to strength while others suggest caution. This article analyses the latest technical parameters, price momentum, and relative performance against the Sensex to provide a comprehensive view for investors.
Read full news articleIntegra Engineering India Ltd Falls 4.63%: Downgrade and Technical Shift Shape Weekly Decline
2026-06-14 15:02:14
Key Events This Week
1 Jun: Downgrade to Strong Sell announced amid financial weakness
2 Jun: Technical momentum shifts to mildly bearish with mixed indicator signals
5 Jun: Stock recovers slightly but closes the week lower at Rs.225.55
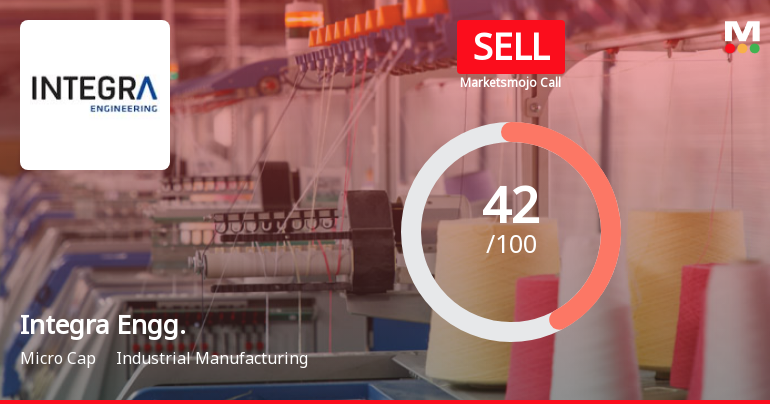
Integra Engineering India Ltd is Rated Sell
2026-06-13 10:10:05Integra Engineering India Ltd is rated 'Sell' by MarketsMOJO, with this rating last updated on 12 June 2026. However, the analysis and financial metrics discussed below reflect the stock's current position as of 13 June 2026, providing investors with the latest insights into the company’s performance and outlook.
Read full news article
Golden Cross Forms in Integra Engineering India Ltd — On a Day the Stock Gained 1.98%. What the Mixed Signals Mean
2026-06-12 18:10:21The 50-day moving average has crossed above the 200-day moving average for Integra Engineering India Ltd, signalling a golden cross on 12 Jun 2026. Yet, the broader technical and fundamental picture presents a nuanced story that tempers the enthusiasm such a crossover might typically inspire.
Read full news article
Integra Engineering India Ltd Downgraded to Strong Sell Amid Technical and Financial Weakness
2026-06-02 08:12:25Integra Engineering India Ltd has been downgraded from a Sell to a Strong Sell rating as of 1 June 2026, reflecting deteriorating technical indicators and weakening financial performance. The company’s Mojo Score has fallen to 27.0, signalling heightened caution for investors amid a challenging market environment and disappointing quarterly results.
Read full news article
Integra Engineering India Ltd Faces Technical Momentum Shift Amid Mixed Indicator Signals
2026-06-02 08:01:15Integra Engineering India Ltd, a micro-cap player in the industrial manufacturing sector, has experienced a notable shift in its technical momentum, signalling increased bearish tendencies despite some bullish weekly indicators. The stock’s recent price action and technical parameters suggest a complex outlook, with mixed signals from key momentum and trend-following indicators.
Read full news article


