
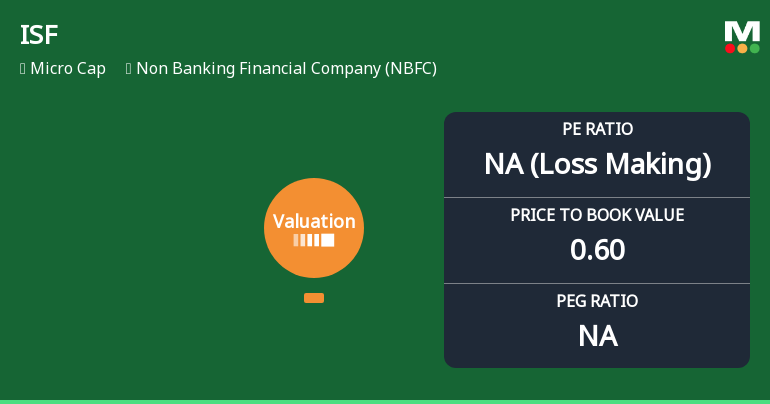
ISF Ltd Valuation Shifts Signal Elevated Risk Amid NBFC Sector Challenges
2026-05-19 08:01:28ISF Ltd, a micro-cap player in the Non Banking Financial Company (NBFC) sector, has seen a marked deterioration in its valuation parameters, shifting from very attractive to risky territory. This change, coupled with weak profitability metrics and a steep decline in stock performance relative to the Sensex, raises significant concerns for investors assessing the company’s price attractiveness and risk profile.
Read full news article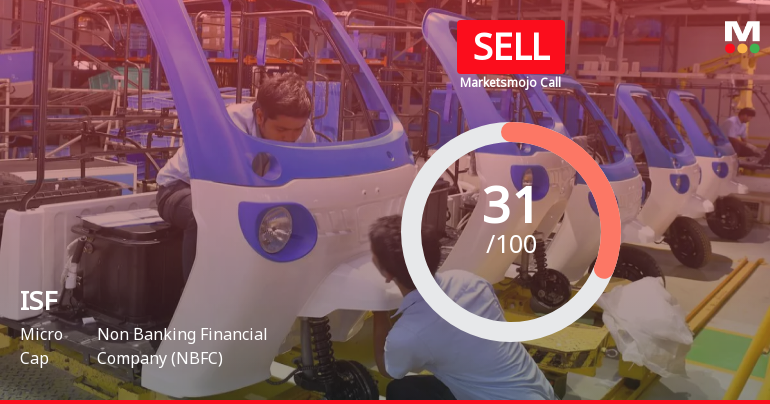
ISF Ltd Upgraded to Sell by MarketsMOJO Amid Mixed Financial and Technical Signals
2026-04-29 08:10:54ISF Ltd, a micro-cap player in the Non Banking Financial Company (NBFC) sector, has seen its investment rating upgraded from Strong Sell to Sell as of 28 Apr 2026. This change is primarily driven by a shift in technical indicators, even as the company’s fundamental and financial trends remain subdued. Investors should weigh the nuanced developments across quality, valuation, financial performance, and technical outlook before making decisions.
Read full news article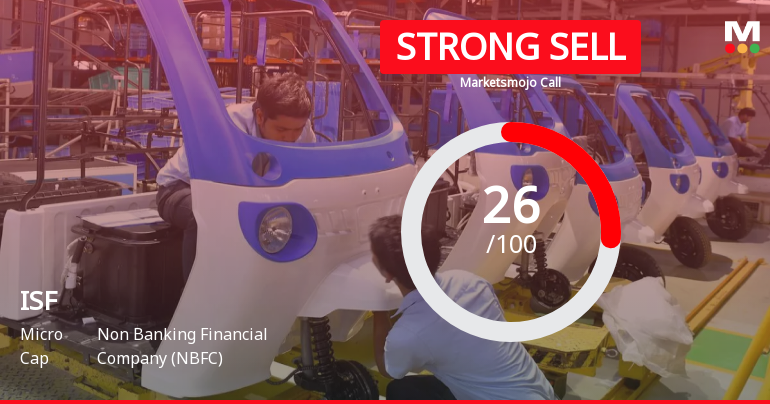
ISF Ltd Downgraded to Strong Sell Amid Weak Fundamentals and Bearish Technicals
2026-04-24 08:07:54ISF Ltd, a micro-cap player in the Non Banking Financial Company (NBFC) sector, has seen its investment rating downgraded from Sell to Strong Sell as of 23 April 2026. This shift reflects deteriorating technical indicators, stagnant financial performance, and a challenging valuation backdrop, signalling caution for investors amid a bearish market environment.
Read full news article
ISF Ltd Upgraded to Sell by MarketsMOJO Amid Mixed Financial and Technical Signals
2026-04-09 08:15:23ISF Ltd, a micro-cap player in the Non Banking Financial Company (NBFC) sector, has seen its investment rating upgraded from Strong Sell to Sell as of 8 April 2026. This change follows a nuanced shift in the company’s technical indicators, even as its fundamental and financial trends remain subdued. The stock’s recent price movement and valuation metrics provide a mixed picture for investors navigating a challenging market environment.
Read full news article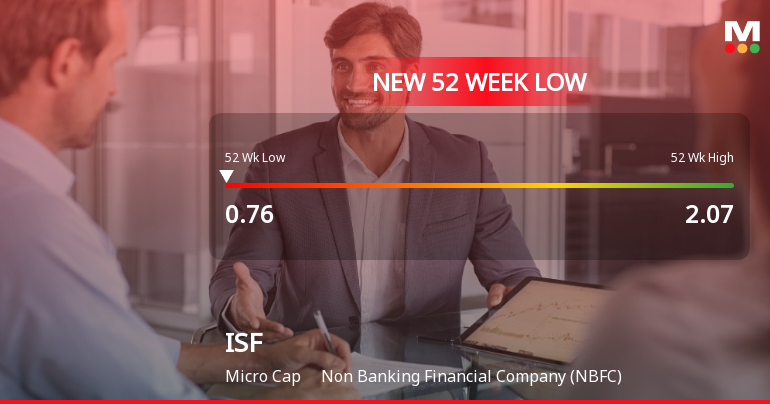
Announcement under Regulation 30 (LODR)-Newspaper Publication
17-May-2026 | Source : BSESubmission of Newspaper Advertisement pursuant to Regulation 47 of SEBI (LODR) Regulations 2015 pertaining to Financial Results for the quarter and year ended 31st March 2026
Announcement under Regulation 30 (LODR)-Resignation of Company Secretary / Compliance Officer
15-May-2026 | Source : BSEResignation of Ms. Anjali Raj from the designation of Company Secretary and Compliance Officer
Integrated Filing_Finance
15-May-2026 | Source : BSEIntegrated Filing_finance for the quarter and year ended 31st March 2026
Corporate Actions

No Upcoming Board Meetings

No Dividend history available

No Splits history available

No Bonus history available

No Rights history available


