
Key Events This Week
11 May: Stock opens at Rs.47.00, down 1.12% amid broad market weakness
12 May: Sharp decline to Rs.45.27 (-3.68%) as Sensex falls over 2%
15 May: Quarterly results reveal positive turnaround but sales challenges persist
15 May: Week closes at Rs.44.13 (-0.62% on day, -7.15% weekly)

Niyogin Fintech Ltd is Rated Strong Sell
2026-05-17 10:10:27Niyogin Fintech Ltd is rated Strong Sell by MarketsMOJO, with this rating last updated on 08 Dec 2025. However, the analysis and financial metrics discussed here reflect the stock’s current position as of 17 May 2026, providing investors with the latest insights into its performance and outlook.
Read full news articleAre Niyogin Fintech Ltd latest results good or bad?
2026-05-15 19:19:18Niyogin Fintech Ltd's latest financial results for Q4 FY26 present a mixed picture, highlighting both some recovery and ongoing challenges. The company reported a consolidated net profit of ₹0.71 crores, a significant increase from ₹0.06 crores in the previous quarter, indicating a recovery in profitability on a quarter-on-quarter basis. However, this figure remains substantially lower than the loss of ₹0.33 crores recorded in the same quarter last year, suggesting that while there is a recovery, it is not yet consistent or sustainable. Net sales for the quarter reached ₹71.97 crores, marking a 14.06% increase from ₹63.10 crores in Q3 FY26 and a modest 3.04% growth year-on-year. This sequential growth is a positive sign, yet the annual growth is limited, reflecting the company's historical revenue volatility. The operating margin improved to 8.41%, the best performance in seven quarters, largely attributed...
Read full news article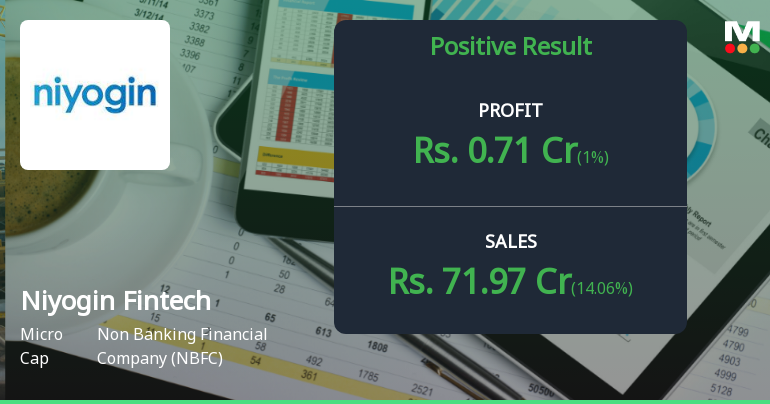
Niyogin Fintech Q4 FY26: Marginal Profit Masks Deeper Structural Concerns
2026-05-15 17:15:33Niyogin Fintech Limited, a micro-cap non-banking financial company with a market capitalisation of ₹508.00 crores, reported consolidated net profit of ₹0.71 crores for Q4 FY26, marking a dramatic turnaround from the ₹0.06 crores posted in Q3 FY26. However, this improvement—representing a sequential surge of 1,083.33%—comes against a backdrop of persistent operational challenges and year-on-year deterioration that continues to plague the Chennai-based fintech player.
Read full news article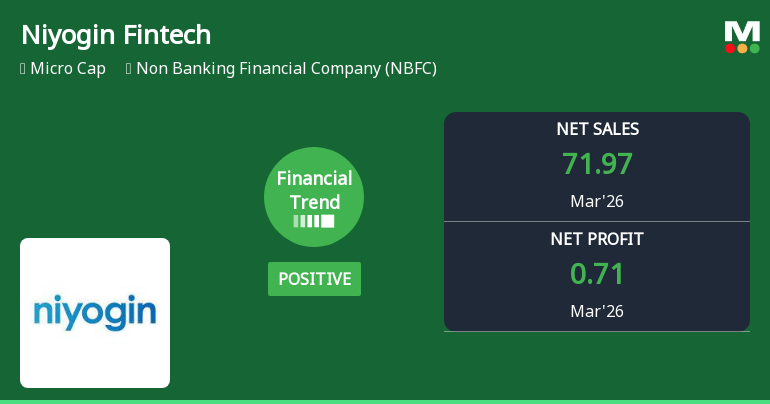
Niyogin Fintech Ltd Reports Positive Quarterly Turnaround Amid Lingering Sales Challenges
2026-05-15 11:00:07Niyogin Fintech Ltd, a micro-cap player in the Non Banking Financial Company (NBFC) sector, has demonstrated a notable financial turnaround in the quarter ended March 2026. After a period of negative trends, the company’s latest quarterly results reveal improvements in profitability metrics, signalling a potential shift in operational momentum despite ongoing challenges in sales growth and market valuation.
Read full news articleWhen is the next results date for Niyogin Fintech Ltd?
2026-05-12 23:16:32The next results date for Niyogin Fintech Ltd is scheduled for 14 May 2026....
Read full news article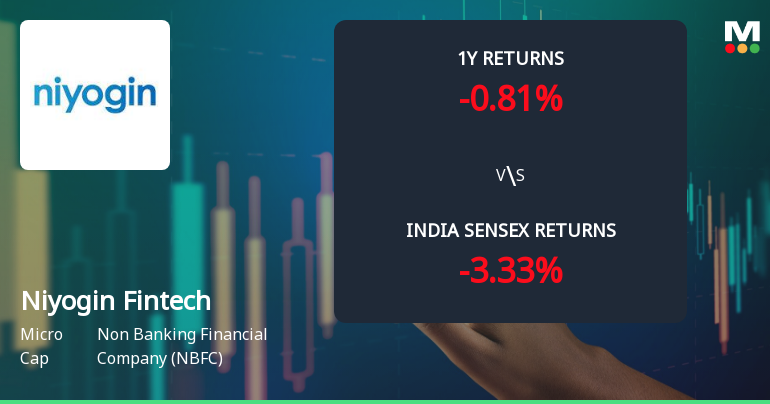
Niyogin Fintech Ltd Technical Momentum Shifts Amid Mixed Market Signals
2026-05-07 08:00:14Niyogin Fintech Ltd, a micro-cap player in the Non Banking Financial Company (NBFC) sector, has experienced a notable shift in its technical momentum, reflecting a transition from sideways trading to a mildly bearish trend. Recent technical indicators present a mixed picture, with some weekly signals showing mild bullishness while monthly trends remain bearish, underscoring the stock’s complex price dynamics amid broader market pressures.
Read full news article


