

Phoenix International Ltd is Rated Strong Sell
2026-06-04 10:10:48Phoenix International Ltd is rated Strong Sell by MarketsMOJO. This rating was last updated on 01 June 2026, reflecting a reassessment of the stock’s outlook. However, all fundamentals, returns, and financial metrics discussed here are based on the company’s current position as of 04 June 2026, providing investors with the most up-to-date analysis.
Read full news articleAre Phoenix International Ltd latest results good or bad?
2026-06-02 19:28:02Phoenix International Ltd's latest financial results for Q4 FY26 present a complex picture characterized by significant revenue growth but notable challenges in profitability. The company reported net sales of ₹7.43 crores, marking a sequential increase of 9.91% and a year-on-year growth of 20.81%. This performance represents the highest quarterly revenue achieved by the company, suggesting a potential stabilization in its core leasing and manufacturing operations. However, the net profit for the quarter was a loss of ₹0.48 crores, which reflects a substantial decline compared to the previous quarter. This loss was primarily attributed to an extraordinary tax expense of ₹1.44 crores, resulting in an effective tax rate of 150.00%. Such a high tax burden has raised concerns regarding the company's tax provisioning practices and their impact on overall profitability. Operationally, the company faced challeng...
Read full news article
Phoenix International Q4 FY26: Tax Anomaly Triggers Loss Despite Revenue Growth
2026-06-01 15:40:55Phoenix International Ltd., a micro-cap diversified commercial services company with a market capitalisation of ₹53.00 crores, reported a net loss of ₹0.48 crores in Q4 FY26, marking a sharp reversal from the ₹0.21 crore profit posted in Q3 FY26. The loss, driven by an extraordinary tax rate of 150.00%, overshadowed an otherwise positive quarter that saw revenue climb to ₹7.43 crores, up 9.91% quarter-on-quarter and 20.81% year-on-year. The stock currently trades at ₹29.72, down 27.51% over the past year and languishing 39.33% below its 52-week high of ₹48.99.
Read full news article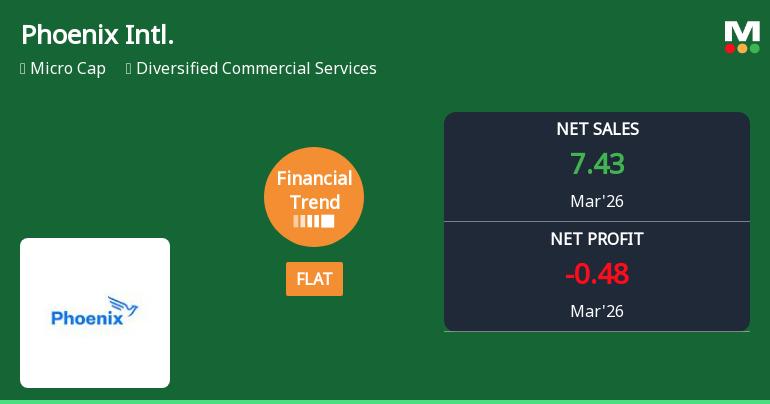
Phoenix International Ltd Reports Flat Quarterly Performance Amid Margin Pressure
2026-06-01 11:01:05Phoenix International Ltd, a micro-cap player in the diversified commercial services sector, has reported a flat financial performance for the quarter ended March 2026, signalling a notable shift from its previously positive growth trajectory. Despite achieving its highest quarterly net sales to date, the company’s profitability metrics have deteriorated, raising concerns among investors and analysts alike.
Read full news article
Phoenix International Ltd is Rated Sell
2026-05-19 10:11:09Phoenix International Ltd is rated 'Sell' by MarketsMOJO, with this rating last updated on 03 Nov 2025. However, the analysis and financial metrics discussed here reflect the company’s current position as of 19 May 2026, providing investors with an up-to-date perspective on the stock’s fundamentals, valuation, financial trends, and technical outlook.
Read full news article
Phoenix International Ltd is Rated Sell
2026-05-07 10:11:23Phoenix International Ltd is rated 'Sell' by MarketsMOJO, with this rating last updated on 03 Nov 2025. However, the analysis and financial metrics discussed here reflect the stock's current position as of 07 May 2026, providing investors with an up-to-date perspective on the company’s fundamentals, valuation, financial trends, and technical outlook.
Read full news article
Phoenix International Ltd is Rated Sell
2026-04-26 10:10:34Phoenix International Ltd is rated 'Sell' by MarketsMOJO, with this rating last updated on 03 Nov 2025. However, the analysis and financial metrics discussed here reflect the stock's current position as of 26 April 2026, providing investors with an up-to-date perspective on the company’s performance and outlook.
Read full news article
Phoenix International Ltd is Rated Sell
2026-04-13 10:10:45Phoenix International Ltd is rated 'Sell' by MarketsMOJO, with this rating last updated on 03 Nov 2025. However, the analysis and financial metrics discussed here reflect the stock's current position as of 13 April 2026, providing investors with an up-to-date view of the company’s fundamentals, valuation, financial trends, and technical outlook.
Read full news article
Phoenix International Ltd is Rated Sell
2026-04-02 10:10:41Phoenix International Ltd is rated 'Sell' by MarketsMOJO, with this rating last updated on 03 Nov 2025. However, the analysis and financial metrics discussed here reflect the stock's current position as of 02 April 2026, providing investors with an up-to-date view of the company’s fundamentals, valuation, financial trends, and technical outlook.
Read full news articleAnnouncement under Regulation 30 (LODR)-Newspaper Publication
01-Jun-2026 | Source : BSENewspaper Publication 31.05.2026
Financial Results For The Quarter And Financial Year Ended 31St March 2026
30-May-2026 | Source : BSEFinancial Results for the Quarter and year ended 31.03.2026
Board Meeting Outcome for Board Meeting Outcome Held On 30Th May 2026
30-May-2026 | Source : BSEOutcome of Board Meeting Dated 30 May 2026.
Corporate Actions

No Upcoming Board Meetings

No Dividend history available

No Splits history available

No Bonus history available

No Rights history available


