Key Events This Week
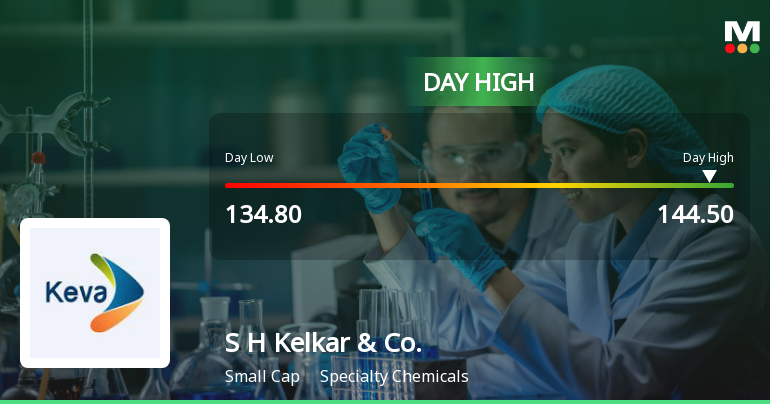
15 Jun: Stock opens at Rs.134.80 with a 5.15% gain
16 Jun: Intraday high of Rs.144.50 with a 7.2% surge
17 Jun: Price correction to Rs.137.55 (-4.35%) on heavy volume
19 Jun: Week closes at Rs.140.00 (+1.19%) despite Sensex dip
Week Open
Rs.128.20