

Sarda Energy & Minerals Ltd: Technical Momentum Shifts Amid Mixed Indicator Signals
2026-06-25 08:03:39Sarda Energy & Minerals Ltd, a small-cap player in the ferrous metals sector, has experienced a subtle shift in its technical momentum, moving from a sideways trend to a mildly bullish stance. Despite this, the company’s overall technical grade was downgraded from Hold to Sell on 23 June 2026, reflecting a complex interplay of technical signals and price action that investors should carefully consider.
Read full news article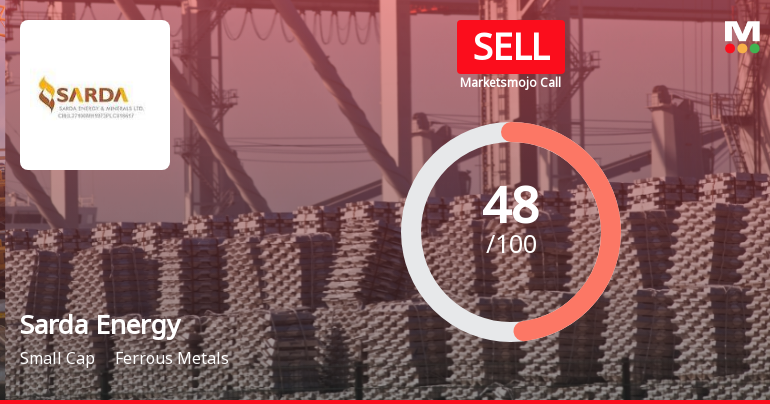
Sarda Energy & Minerals Ltd Downgraded to Sell Amid Mixed Fundamentals and Technical Signals
2026-06-24 08:18:46Sarda Energy & Minerals Ltd, a small-cap player in the ferrous metals sector, has seen its investment rating downgraded from Hold to Sell as of 23 June 2026. This revision reflects a combination of deteriorating technical indicators, valuation pressures, and nuanced financial trends despite solid operational performance. The company’s Mojo Score now stands at 48.0, signalling caution for investors amid mixed signals across quality, valuation, financial trend, and technical parameters.
Read full news article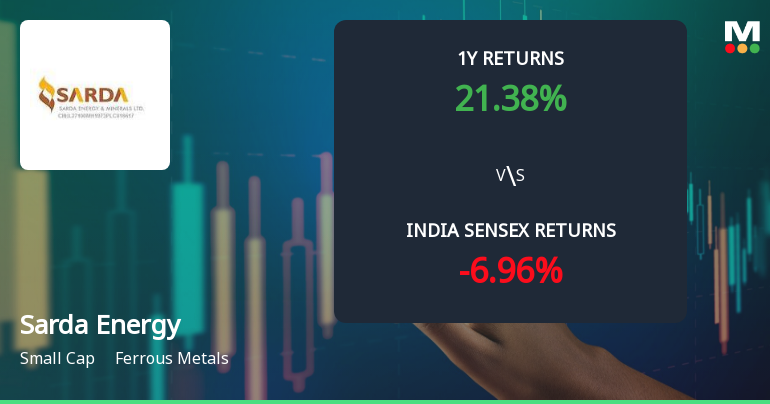
Sarda Energy & Minerals Ltd Faces Technical Momentum Shift Amid Mixed Market Signals
2026-06-24 08:04:09Sarda Energy & Minerals Ltd, a small-cap player in the ferrous metals sector, has experienced a notable shift in its technical momentum, moving from a mildly bullish stance to a sideways trend. Despite a recent downgrade from Hold to Sell by MarketsMOJO, the stock’s long-term returns remain impressive, though short-term indicators suggest caution for investors.
Read full news article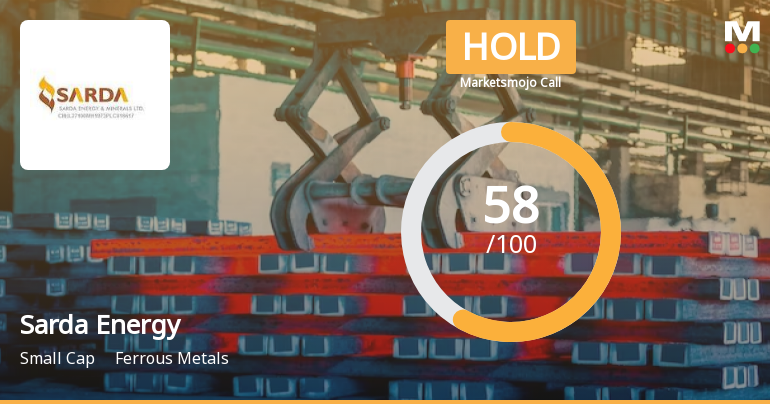
Sarda Energy & Minerals Ltd is Rated Hold
2026-06-15 10:10:04Sarda Energy & Minerals Ltd is rated 'Hold' by MarketsMOJO, with this rating last updated on 09 April 2026. However, the analysis and financial metrics presented here reflect the stock's current position as of 15 June 2026, providing investors with an up-to-date view of the company’s fundamentals, returns, and market standing.
Read full news article
Sarda Energy & Minerals Ltd is Rated Hold
2026-06-04 10:10:04Sarda Energy & Minerals Ltd is rated 'Hold' by MarketsMOJO, with this rating last updated on 09 April 2026. However, the analysis and financial metrics discussed below reflect the company’s current position as of 04 June 2026, providing investors with an up-to-date perspective on the stock’s fundamentals, valuation, financial trends, and technical outlook.
Read full news articleAre Sarda Energy & Minerals Ltd latest results good or bad?
2026-05-24 19:13:28Sarda Energy & Minerals Ltd reported its latest financial results for the quarter ended March 2026, showcasing a mixed performance. The company achieved net sales of ₹1,253.57 crores, reflecting a year-on-year growth of 1.19%. This growth, however, is significantly lower compared to the previous year's strong performance of 39.31%. In terms of net profit, Sarda Energy reported ₹157.99 crores, which marks a notable year-on-year increase of 45.90%, contrasting with a decline of 17.01% when compared sequentially to the previous quarter. The operating margin, excluding other income, stood at 28.02%, which is an improvement from 22.00% in the same quarter last year, but it represents a decline from 24.65% in the previous quarter. This indicates some challenges in maintaining profitability in the face of rising input costs and fluctuating demand. The company's return on equity (ROE) averaged 18.03%, demonstratin...
Read full news article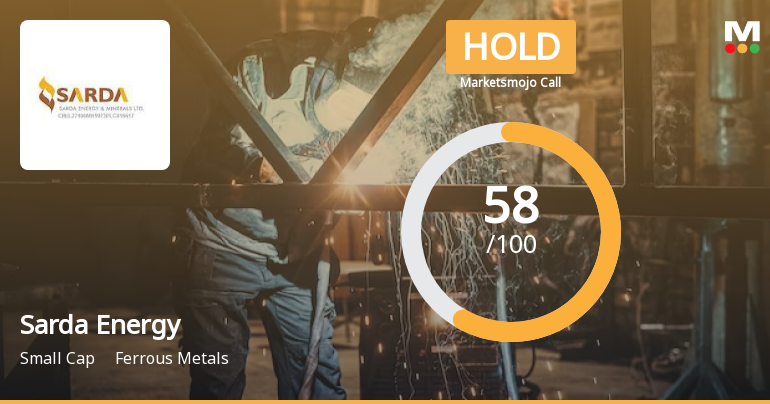
Sarda Energy & Minerals Ltd is Rated Hold
2026-05-24 10:10:03Sarda Energy & Minerals Ltd is rated 'Hold' by MarketsMOJO, with this rating last updated on 09 Apr 2026. While the rating change occurred on that date, the analysis and financial metrics presented here reflect the stock's current position as of 24 May 2026, providing investors with an up-to-date view of the company’s fundamentals, returns, and market standing.
Read full news article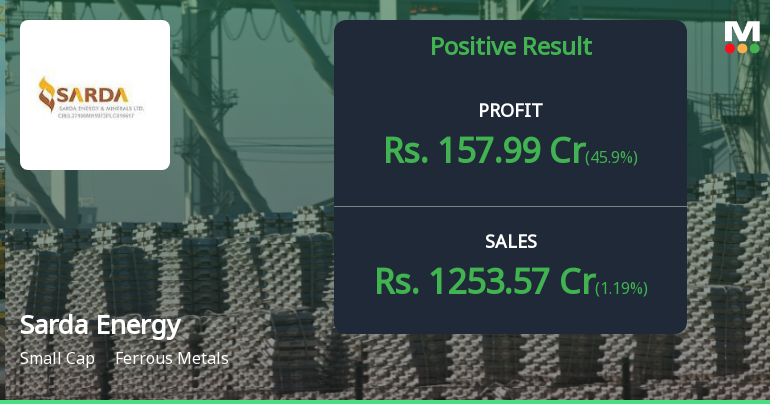
Sarda Energy Q4 FY26: Profit Surge Masks Margin Pressures in Steel Downturn
2026-05-23 22:46:20Sarda Energy & Minerals Ltd., the integrated steel and ferro-alloy manufacturer backed by captive power, reported a consolidated net profit of ₹157.99 crores for Q4 FY26, marking a robust 45.90% year-on-year growth despite challenging industry conditions. However, the quarter-on-quarter narrative reveals mounting pressures, with profits declining 17.01% from Q3 FY26's ₹190.37 crores, as steel realisations weakened and operating margins compressed significantly.
Read full news article
Sarda Energy & Minerals Ltd is Rated Hold
2026-05-13 10:10:52Sarda Energy & Minerals Ltd is rated 'Hold' by MarketsMOJO, with this rating last updated on 09 Apr 2026. However, the analysis and financial metrics discussed here reflect the company’s current position as of 13 May 2026, providing investors with an up-to-date view of its fundamentals, returns, and market standing.
Read full news articleDisruption At Hydro Power Plant Of Madhya Bharat Power Corporation Ltd.
18-Jun-2026 | Source : BSEDisruption at Hydro Power plant of Madhya Bharat Power Corporation Ltd.
Update
05-Jun-2026 | Source : BSEUpdate
Announcement under Regulation 30 (LODR)-Analyst / Investor Meet - Intimation
05-Jun-2026 | Source : BSEDetails as per attachment and Xbrl filing
Corporate Actions

No Upcoming Board Meetings

Sarda Energy & Minerals Ltd has declared 150% dividend, ex-date: 22 Aug 25

Sarda Energy & Minerals Ltd has announced 1:10 stock split, ex-date: 04 Aug 23

No Bonus history available

No Rights history available


