
Compare Sarda Energy with Similar Stocks
Dashboard
With ROE of 14.9, it has a Expensive valuation with a 2.5 Price to Book Value
- The stock is trading at a discount compared to its peers' average historical valuations
- Over the past year, while the stock has generated a return of 16.64%, its profits have risen by 56.9% ; the PEG ratio of the company is 0.3
Despite the size of the company, domestic mutual funds hold only 1.73% of the company
Stock DNA
Ferrous Metals
INR 18,031 Cr (Small Cap)
17.00
26
0.29%
0.03
14.91%
2.46
Total Returns (Price + Dividend) 
Latest dividend: 1.5 per share ex-dividend date: Aug-22-2025
Risk Adjusted Returns v/s
Returns Beta

News

Sarda Energy & Minerals Ltd: Technical Momentum Shifts Amid Mixed Indicator Signals
Sarda Energy & Minerals Ltd, a small-cap player in the ferrous metals sector, has experienced a subtle shift in its technical momentum, moving from a sideways trend to a mildly bullish stance. Despite this, the company’s overall technical grade was downgraded from Hold to Sell on 23 June 2026, reflecting a complex interplay of technical signals and price action that investors should carefully consider.
Read full news article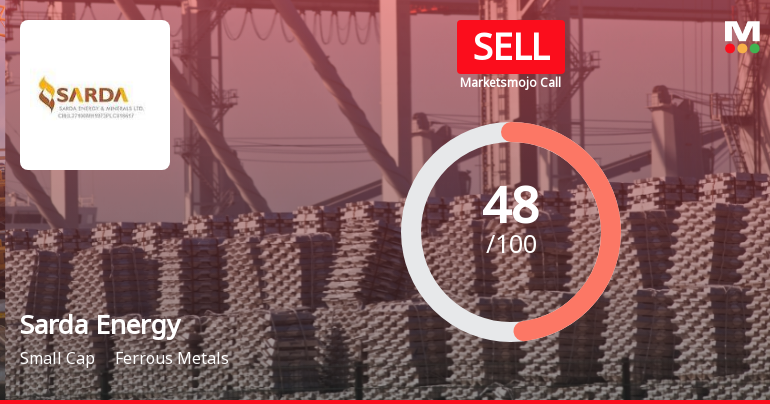
Sarda Energy & Minerals Ltd Downgraded to Sell Amid Mixed Fundamentals and Technical Signals
Sarda Energy & Minerals Ltd, a small-cap player in the ferrous metals sector, has seen its investment rating downgraded from Hold to Sell as of 23 June 2026. This revision reflects a combination of deteriorating technical indicators, valuation pressures, and nuanced financial trends despite solid operational performance. The company’s Mojo Score now stands at 48.0, signalling caution for investors amid mixed signals across quality, valuation, financial trend, and technical parameters.
Read full news article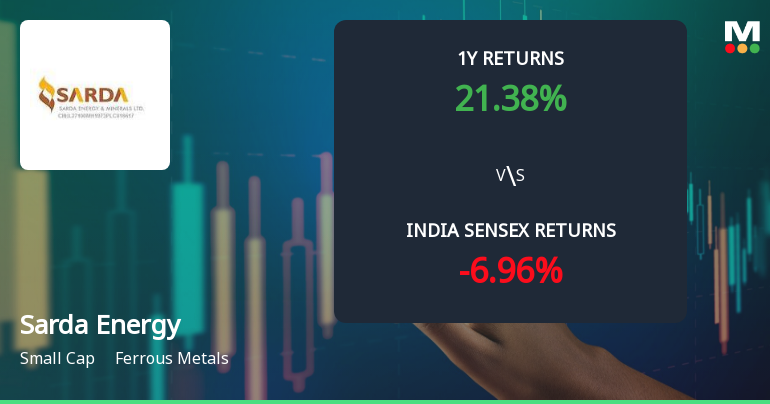
Sarda Energy & Minerals Ltd Faces Technical Momentum Shift Amid Mixed Market Signals
Sarda Energy & Minerals Ltd, a small-cap player in the ferrous metals sector, has experienced a notable shift in its technical momentum, moving from a mildly bullish stance to a sideways trend. Despite a recent downgrade from Hold to Sell by MarketsMOJO, the stock’s long-term returns remain impressive, though short-term indicators suggest caution for investors.
Read full news article Announcements
Disruption At Hydro Power Plant Of Madhya Bharat Power Corporation Ltd.
18-Jun-2026 | Source : BSEDisruption at Hydro Power plant of Madhya Bharat Power Corporation Ltd.
Update
05-Jun-2026 | Source : BSEUpdate
Announcement under Regulation 30 (LODR)-Analyst / Investor Meet - Intimation
05-Jun-2026 | Source : BSEDetails as per attachment and Xbrl filing
Corporate Actions

No Upcoming Board Meetings

Sarda Energy & Minerals Ltd has declared 150% dividend, ex-date: 22 Aug 25

Sarda Energy & Minerals Ltd has announced 1:10 stock split, ex-date: 04 Aug 23

No Bonus history available

No Rights history available
Quality key factors
Valuation key factors
Technicals key factors
 Technical Indicator Scale: Bearish, Mildly Bearish, Sideways, Mildly Bullish, Bullish Turned
 Shareholding Snapshot : Mar 2026
Shareholding Compare (%holding)
Promoters
None
Held by 17 Schemes (0.46%)
Held by 101 FIIs (3.51%)
Chhattisgarh Investments Ltd. (39.04%)
Abakkus Emerging Opportunities Fund -1 (1.45%)
15.65%
Quarterly Results Snapshot (Consolidated) - Mar'26 - YoY

YoY Growth in quarter ended Mar 2026 is 1.19% vs 39.31% in Mar 2025

YoY Growth in quarter ended Mar 2026 is 45.90% vs 14.74% in Mar 2025
Half Yearly Results Snapshot (Consolidated) - Sep'25
Growth in half year ended Sep 2025 is 51.61% vs 1.53% in Sep 2024
Growth in half year ended Sep 2025 is 92.19% vs 26.55% in Sep 2024
Nine Monthly Results Snapshot (Consolidated) - Dec'25
YoY Growth in nine months ended Dec 2025 is 30.34% vs 14.27% in Dec 2024
YoY Growth in nine months ended Dec 2025 is 60.25% vs 38.00% in Dec 2024
Annual Results Snapshot (Consolidated) - Mar'26
YoY Growth in year ended Mar 2026 is 22.56% vs 20.03% in Mar 2025
YoY Growth in year ended Mar 2026 is 58.02% vs 33.81% in Mar 2025
About Sarda Energy & Minerals Ltd

Company Coordinates


