


Key Events This Week
22 Jun: Silkflex Polymers surged to upper circuit at Rs.214.45 (+4.99%)
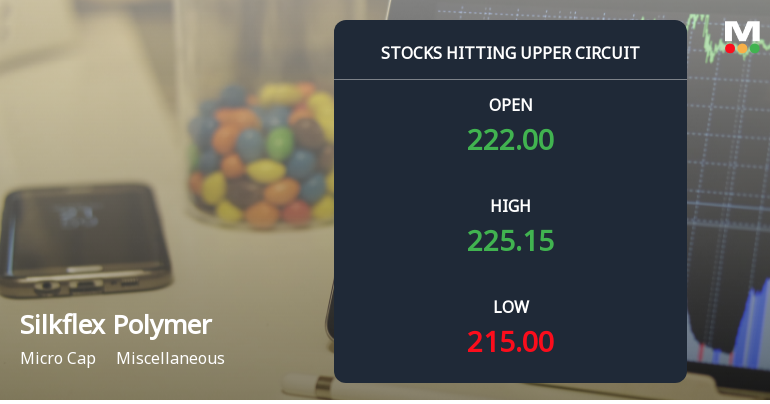
23 Jun: Another upper circuit hit, closing at Rs.225.15 (+4.99%)
24 Jun: Stock reached all-time high of Rs.232.5 (+2.68%)
25 Jun: Sharp reversal with lower circuit hit at Rs.216.60 (-5.00%)

Silkflex Polymers (India) Ltd Locks at Lower Circuit With 5.0% Loss — Sellers Queue, No Buyers in Sight
2026-06-25 10:00:41At Rs 216.6, sellers were still queuing — but there were no buyers willing to take the other side. Silkflex Polymers (India) Ltd locked at its lower circuit of 5.0% on 25 Jun 2026, with unfilled sell orders and a frozen price.
Read full news article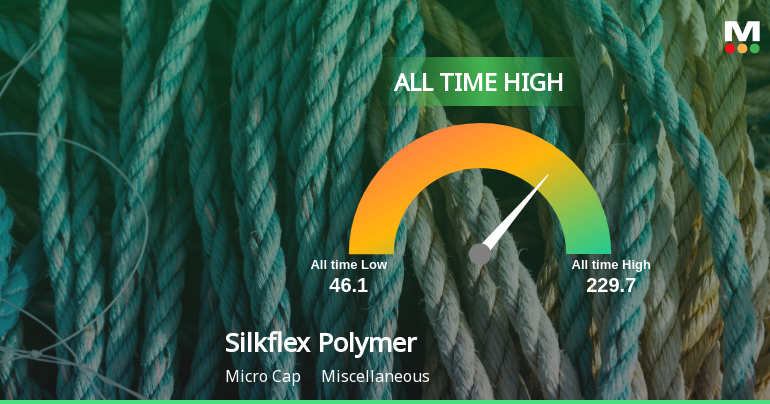
Silkflex Polymers (India) Ltd Locks at Upper Circuit With 5% Gain — Buyers Queue, Sellers Absent
2026-06-23 12:00:17At Rs 225.15, the buying was done — not because demand dried up, but because the exchange wouldn't let the stock go any higher. Silkflex Polymers (India) Ltd locked at its upper circuit of 4.99% on 23 Jun 2026, with buyers queuing and no sellers willing to part with shares.
Read full news article
Silkflex Polymers (India) Ltd is Rated Buy
2026-06-23 10:11:18Silkflex Polymers (India) Ltd is rated 'Buy' by MarketsMOJO, with this rating last updated on 08 Jun 2026. However, all fundamentals, returns, and financial metrics discussed here reflect the company’s current position as of 23 June 2026, providing investors with the most up-to-date analysis.
Read full news article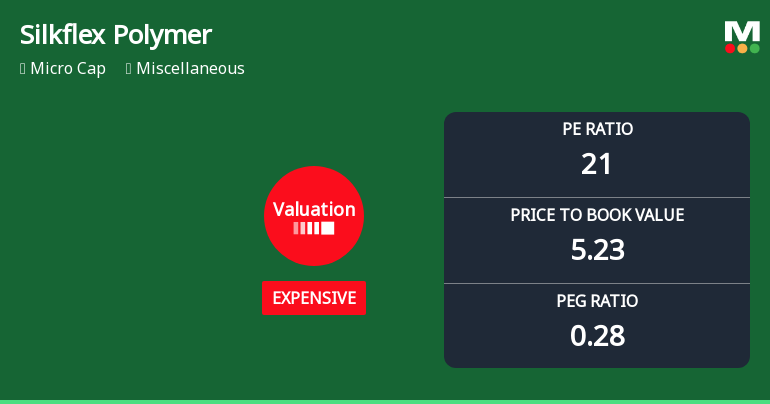
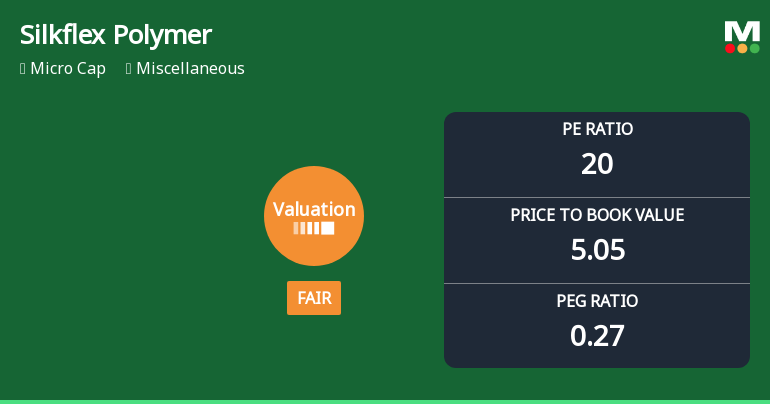
Silkflex Polymers (India) Ltd: Valuation Shift Signals Price Attractiveness Change
2026-06-23 08:01:26Silkflex Polymers (India) Ltd has witnessed a notable shift in its valuation parameters, moving from a fair to an expensive rating, reflecting evolving market perceptions amid robust price gains and strong operational metrics. This article analyses the recent changes in key valuation multiples, compares them with peer averages and historical benchmarks, and assesses the implications for investors considering this micro-cap stock.
Read full news article


