
Compare Silkflex Polymer with Similar Stocks
Dashboard
High Management Efficiency with a high ROCE of 19.36%
Healthy long term growth as Net Sales has grown by an annual rate of 41.10% and Operating profit at 93.07%
With ROCE of 18.4, it has a Fair valuation with a 2.7 Enterprise value to Capital Employed
Majority shareholders : Promoters
Below par performance in long term as well as near term
Total Returns (Price + Dividend) 
Silkflex Polymer for the last several years.
Risk Adjusted Returns v/s
Returns Beta

News

Silkflex Polymers (India) Ltd is Rated Hold
Silkflex Polymers (India) Ltd is rated 'Hold' by MarketsMOJO, with this rating last updated on 06 July 2026. While the rating change occurred on that date, the analysis and financial metrics presented here reflect the company’s current position as of 15 July 2026, providing investors with the most up-to-date view of the stock’s fundamentals, returns, and technical outlook.
Read full news article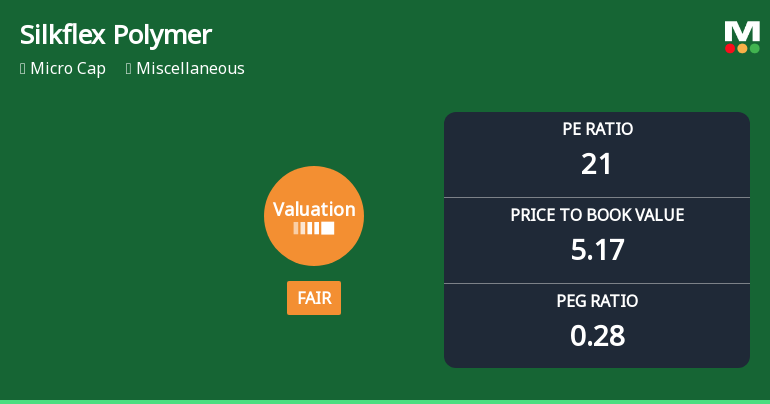
Silkflex Polymers Valuation Shifts to Fair Amid Strong Returns
Silkflex Polymers (India) Ltd has experienced a notable shift in its valuation parameters, moving from an expensive to a fair valuation grade. This adjustment reflects evolving market perceptions amid robust financial metrics and a strong year-to-date return, positioning the micro-cap stock under closer scrutiny by investors and analysts alike.
Read full news article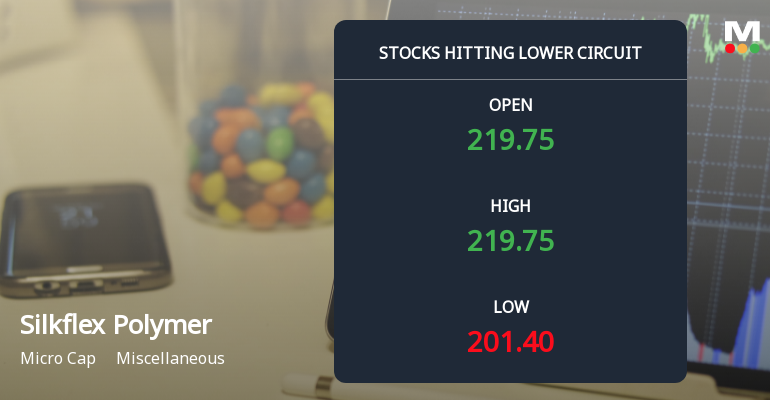
Below All Moving Averages and Now at Lower Circuit: Silkflex Polymers (India) Ltd Loses 4.25% in a Single Session
At Rs 203.0, sellers were still queuing — but there were no buyers willing to take the other side. Silkflex Polymers (India) Ltd locked at its lower circuit of 5% on 07 Jul 2026, with unfilled sell orders and a frozen price, signalling persistent selling pressure despite the price floor.
Read full news article Announcements
Corporate Actions

No Upcoming Board Meetings

No Dividend history available

No Splits history available

No Bonus history available

No Rights history available
Quality key factors
Valuation key factors
Technicals key factors
 Technical Indicator Scale: Bearish, Mildly Bearish, Sideways, Mildly Bullish, Bullish Turned
 Shareholding Snapshot : Mar 2026
Shareholding Compare (%holding)
Promoters
None
Held by 0 Schemes
Held by 0 FIIs
Tushar Lalit Kumar Sanghavi (57.68%)
India Equity Fund 1 (8.94%)
15.88%
Quarterly Results Snapshot (Standalone) - Mar'26 - QoQ

QoQ Growth in quarter ended Mar 2026 is 16.49% vs 78.40% in Dec 2025
QoQ Growth in quarter ended Mar 2026 is 14.78% vs 134.68% in Dec 2025
Half Yearly Results Snapshot (Standalone) - Mar'26

Growth in half year ended Mar 2026 is 93.16% vs -16.49% in Sep 2025
Growth in half year ended Mar 2026 is 154.23% vs -9.97% in Sep 2025
Nine Monthly Results Snapshot (Standalone) - Dec'25
YoY Growth in nine months ended Dec 2025 is -4.16% vs 18.17% in Mar 2026
YoY Growth in nine months ended Dec 2025 is -4.59% vs 22.27% in Mar 2026
Annual Results Snapshot (Standalone) - Mar'26
YoY Growth in year ended Mar 2026 is 37.73% vs 59.16% in Mar 2025
YoY Growth in year ended Mar 2026 is 73.57% vs 78.12% in Mar 2025
About Silkflex Polymers (India) Ltd

Company Coordinates


