

Key Events This Week
22 Jun: Valuation shifts signal changing market perception amid a 4.82% drop
23 Jun: Continued decline with 1.16% loss as Sensex falls 1.05%
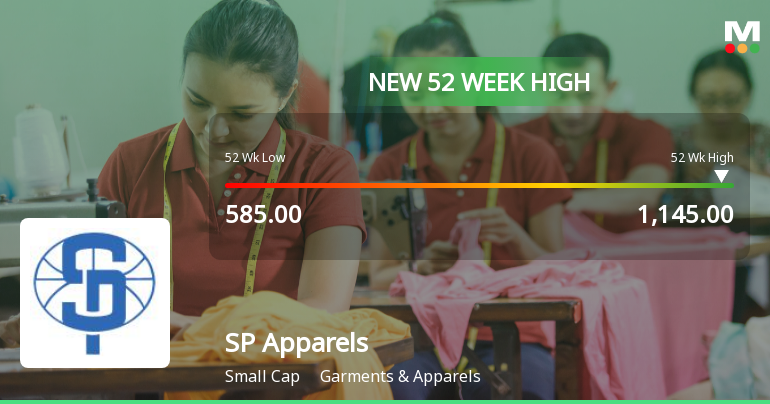
24 Jun: Stock surges 15.00%, hits new 52-week and all-time highs
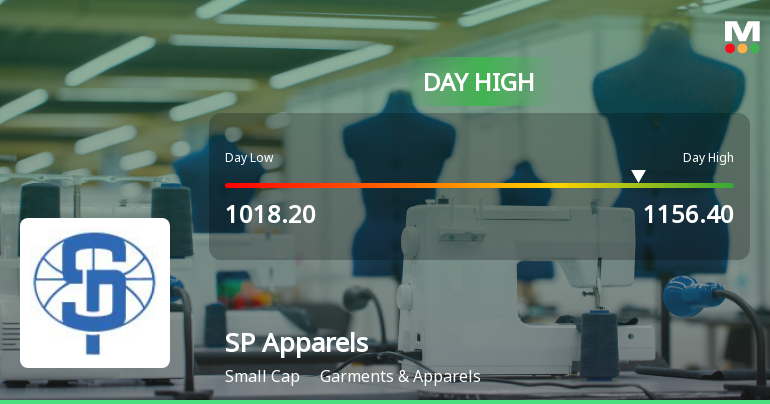
25 Jun: New 52-week high at Rs.1142, closes with modest 0.88% loss

Broad-Based Technical Strength Lifts SP Apparels Ltd. to 52-Week High of Rs 1142
2026-06-25 13:40:35Surging to an all-time high of Rs 1142 on 25 Jun 2026, SP Apparels Ltd. has demonstrated remarkable price momentum, outperforming its sector and the broader market with a 32.7% gain over the past year against the Sensex’s decline of 6.31%.
Read full news article
SP Apparels Ltd. Hits All-Time High of Rs 1,138 as Momentum Builds Across Timeframes
2026-06-25 13:32:35Extending its remarkable rally, SP Apparels Ltd. touched a fresh all-time high of Rs 1,138 on 25 Jun 2026, marking a significant milestone in its multi-year ascent that has far outpaced the broader market.
Read full news article
SP Apparels Ltd. is Rated Hold by MarketsMOJO
2026-06-25 10:10:05SP Apparels Ltd. is rated 'Hold' by MarketsMOJO, with this rating last updated on 20 May 2026. However, the analysis and financial metrics discussed here reflect the company’s current position as of 25 June 2026, providing investors with the most up-to-date view of the stock’s fundamentals, returns, and technical outlook.
Read full news article
SP Apparels Ltd. Hits All-Time High of Rs 1,125 as Momentum Builds Across Timeframes
2026-06-24 15:22:11Extending its winning streak after a brief pause, SP Apparels Ltd. surged 15.77% on 24 Jun 2026 to touch a fresh all-time high of Rs 1,125, significantly outpacing the Sensex’s modest 1.00% gain. This milestone caps a remarkable run that has seen the stock rally 59.80% year-to-date, far outperforming its sector and the broader market.
Read full news article


