
Compare SP Apparels with Similar Stocks
Dashboard
Strong ability to service debt as the company has a low Debt to EBITDA ratio of 1.92 times
Poor long term growth as Operating profit has grown by an annual rate 18.73% of over the last 5 years
With ROCE of 13.1, it has a Fair valuation with a 2.4 Enterprise value to Capital Employed
Falling Participation by Institutional Investors
Consistent Returns over the last 3 years
Stock DNA
Garments & Apparels
INR 2,873 Cr (Small Cap)
28.00
26
0.18%
0.37
10.73%
2.93
Total Returns (Price + Dividend) 
Latest dividend: 2 per share ex-dividend date: Aug-25-2025
Risk Adjusted Returns v/s
Returns Beta

News
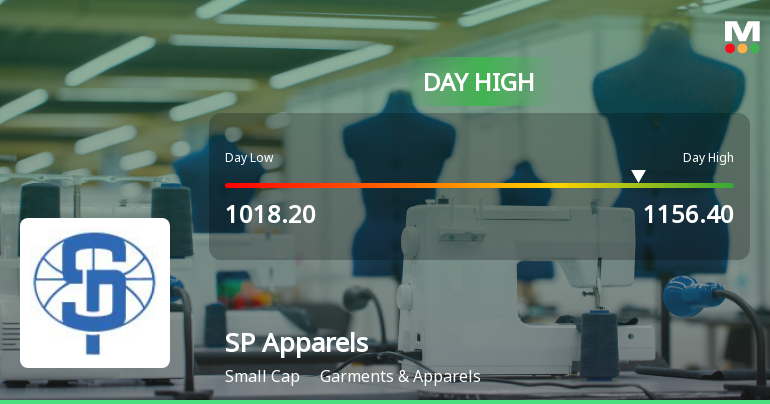
SP Apparels Ltd. Surges 8.83% to Day's High of Rs 1156.4 — Outperforms Sector by 8.7 Percentage Points
The Sensex slipped 0.16% on 30 Jun 2026, while SP Apparels Ltd. surged 8.83%, hitting a new 52-week and all-time high of Rs 1156.4. This 8.7-percentage-point outperformance over its Garments & Apparels sector peers signals a distinctly stock-specific rally rather than a broad market lift.
Read full news article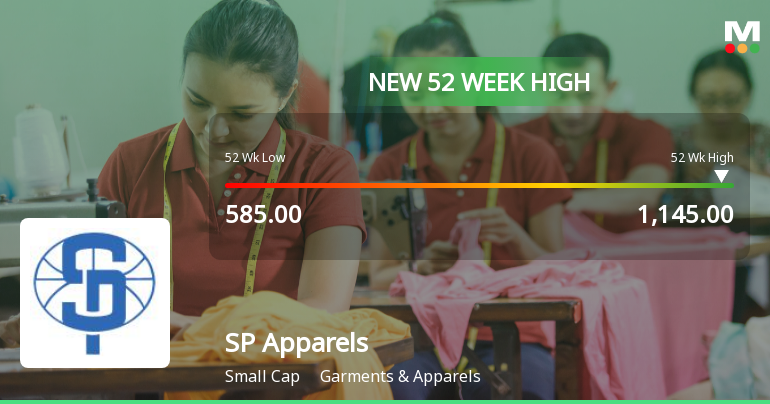
Broad-Based Technical Strength Lifts SP Apparels Ltd. to 52-Week High of Rs 1109
With a notable intraday surge to Rs 1109 on 30 Jun 2026, SP Apparels Ltd. has approached its 52-week high of Rs 1145, marking a significant milestone in its price momentum. This rally comes amid a backdrop of strong technical signals and sustained outperformance relative to its sector and the broader market.
Read full news article
Announcements
S. P. Apparels Limited - Press Release
18-Nov-2019 | Source : NSES. P. Apparels Limited has informed the Exchange regarding a press release dated November 15, 2019, titled "Extract of Unaudited Consolidated Financial Result".
S. P. Apparels Limited - Outcome of Board Meeting
15-Nov-2019 | Source : NSES. P. Apparels Limited has informed the Exchange regarding Board meeting held on November 14, 2019.
S. P. Apparels Limited - Analysts/Institutional Investor Meet/Con. Call Updates
13-Nov-2019 | Source : NSES. P. Apparels Limited has informed the Exchange regarding Analysts/Institutional Investor Meet/Con. Call Updates
Corporate Actions

No Upcoming Board Meetings

SP Apparels Ltd. has declared 20% dividend, ex-date: 25 Aug 25

No Splits history available

No Bonus history available

No Rights history available
Quality key factors
Valuation key factors
Technicals key factors
 Technical Indicator Scale: Bearish, Mildly Bearish, Sideways, Mildly Bullish, Bullish Turned
 Shareholding Snapshot : Mar 2026
Shareholding Compare (%holding)
Promoters
None
Held by 5 Schemes (15.07%)
Held by 46 FIIs (1.48%)
Perumal Sundararajan (49.88%)
Dsp Small Cap Fund (7.68%)
14.35%
Quarterly Results Snapshot (Consolidated) - Mar'26 - YoY

YoY Growth in quarter ended Mar 2026 is -8.59% vs 35.27% in Mar 2025
YoY Growth in quarter ended Mar 2026 is -39.23% vs 6.78% in Mar 2025
Half Yearly Results Snapshot (Consolidated) - Sep'25

Growth in half year ended Sep 2025 is 30.50% vs 17.87% in Sep 2024
Growth in half year ended Sep 2025 is 38.49% vs -8.15% in Sep 2024
Nine Monthly Results Snapshot (Consolidated) - Dec'25
YoY Growth in nine months ended Dec 2025 is 21.87% vs 25.71% in Dec 2024
YoY Growth in nine months ended Dec 2025 is 28.32% vs 4.89% in Dec 2024
Annual Results Snapshot (Consolidated) - Mar'26
YoY Growth in year ended Mar 2026 is 13.15% vs 28.30% in Mar 2025
YoY Growth in year ended Mar 2026 is 5.98% vs 6.10% in Mar 2025
About SP Apparels Ltd.

Company Coordinates


