
Compare Siyaram Silk with Similar Stocks
Stock DNA
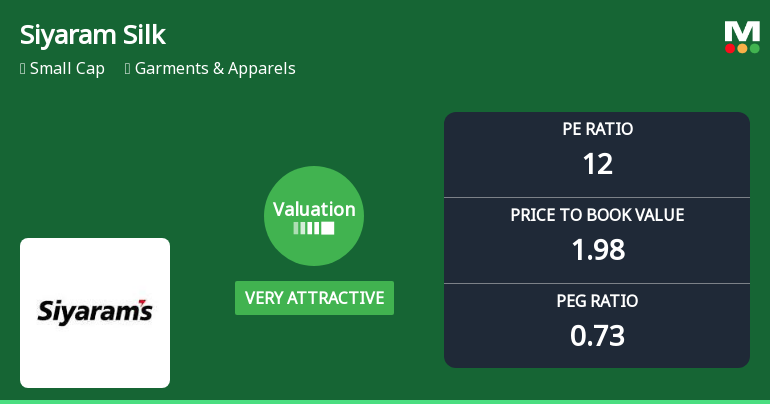
Garments & Apparels
INR 2,905 Cr (Small Cap)
12.00
45
2.51%
0.09
15.81%
1.98
Total Returns (Price + Dividend) 
Latest dividend: 4 per share ex-dividend date: May-25-2026
Risk Adjusted Returns v/s
Returns Beta

News
Siyaram Silk Mills Ltd Valuation Shifts Signal Renewed Price Attractiveness
Siyaram Silk Mills Ltd, a small-cap player in the Garments & Apparels sector, has seen a notable shift in its valuation parameters, moving from an attractive to a very attractive rating. This change comes amid a backdrop of stable financial metrics and a valuation that compares favourably against its peers, despite a modest day decline of 0.23% to close at ₹637.40 on 2 July 2026.
Read full news article
Siyaram Silk Mills Ltd Downgraded to Sell Amid Mixed Financial and Technical Signals
Siyaram Silk Mills Ltd, a small-cap player in the Garments & Apparels sector, has seen its investment rating downgraded from Hold to Sell as of 29 June 2026. The revision primarily stems from a deterioration in technical indicators, despite the company’s robust financial performance and attractive valuation metrics. This article analyses the four key parameters—Quality, Valuation, Financial Trend, and Technicals—that influenced this change in rating.
Read full news article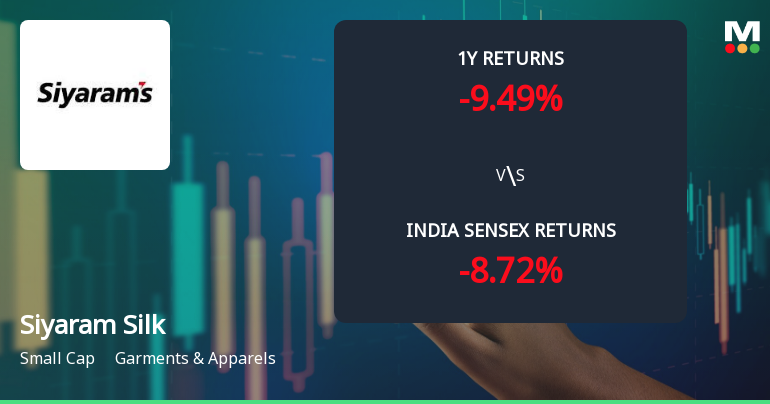
Siyaram Silk Mills Ltd Technical Momentum Shifts Amid Mixed Market Signals
Siyaram Silk Mills Ltd has experienced a notable shift in its technical momentum, transitioning from a sideways trend to a mildly bearish stance. Despite this, the stock exhibits a complex interplay of bullish and bearish signals across various technical indicators, reflecting a nuanced market sentiment for this small-cap garment and apparel company.
Read full news article Announcements
Siyaram Silk Mills Limited - Dividend
22-Oct-2019 | Source : NSESiyaram Silk Mills Limited has informed the Exchange that Board of Directors at its meeting held on October 19, 2019, declared Interim Dividend of 6.20 per equity share.
Price movement
16-Sep-2019 | Source : NSE
| Significant movement in price has been observed in Siyaram Silk Mills Limited. The Exchange, in order to ensure that investors have latest relevant information about the company and to inform the market place so that the interest of the investors is safeguarded, has written to the company. The response from the company is awaited. |
Updates
10-Sep-2019 | Source : NSE
| Siyaram Silk Mills Limited has informed the Exchange regarding ''. disclosure pursuant to Regulation 30 read with PART A of Schedule III of the SEBI (Listing Obligations and Disclosure Requirements) Regulations, 2015. |
Corporate Actions

No Upcoming Board Meetings

Siyaram Silk Mills Ltd has declared 200% dividend, ex-date: 25 May 26

Siyaram Silk Mills Ltd has announced 2:10 stock split, ex-date: 25 Oct 17

Siyaram Silk Mills Ltd has announced 1:2 bonus issue, ex-date: 19 Oct 06

No Rights history available
Quality key factors
Valuation key factors
Technicals key factors
 Technical Indicator Scale: Bearish, Mildly Bearish, Sideways, Mildly Bullish, Bullish Turned
 Shareholding Snapshot : Mar 2026
Shareholding Compare (%holding)
Promoters
None
Held by 1 Schemes (0.0%)
Held by 63 FIIs (2.26%)
Pkp Enterprises Llp (23.81%)
Abakkus Emerging Opportunities Fund-1 (1.59%)
22.94%
Quarterly Results Snapshot (Consolidated) - Mar'26 - YoY

YoY Growth in quarter ended Mar 2026 is 15.91% vs 13.65% in Mar 2025
YoY Growth in quarter ended Mar 2026 is 35.71% vs 4.37% in Mar 2025
Half Yearly Results Snapshot (Consolidated) - Sep'25
Growth in half year ended Sep 2025 is 19.72% vs -2.79% in Sep 2024
Growth in half year ended Sep 2025 is 14.63% vs 11.78% in Sep 2024
Nine Monthly Results Snapshot (Consolidated) - Dec'25
YoY Growth in nine months ended Dec 2025 is 15.74% vs 2.85% in Dec 2024

YoY Growth in nine months ended Dec 2025 is 6.43% vs 8.08% in Dec 2024
Annual Results Snapshot (Consolidated) - Mar'26
YoY Growth in year ended Mar 2026 is 15.79% vs 6.19% in Mar 2025
YoY Growth in year ended Mar 2026 is 17.14% vs 6.70% in Mar 2025
About Siyaram Silk Mills Ltd

Company Coordinates


