
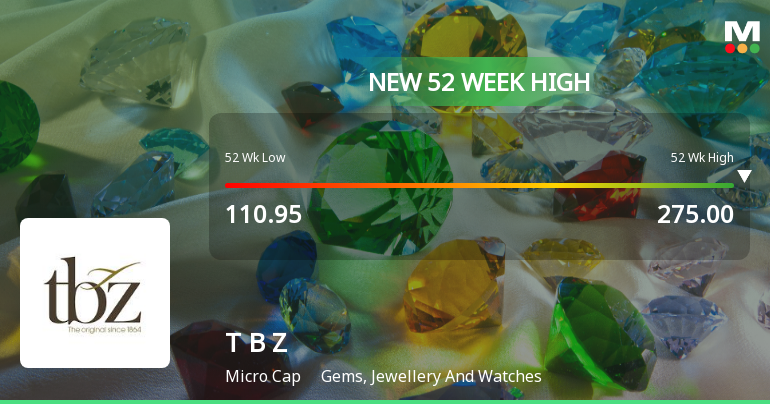
Broad-Based Technical Strength Lifts Tribhovandas Bhimji Zaveri Ltd to 52-Week High of Rs 270.65
2026-07-27 15:05:16With a decisive intraday surge pushing the price to Rs 270.65 on 27 Jul 2026, Tribhovandas Bhimji Zaveri Ltd has reached a fresh 52-week high, underscoring a sustained momentum that has outpaced the broader market and its sector peers.
Read full news article
Tribhovandas Bhimji Zaveri Ltd is Rated Strong Buy
2026-07-20 10:10:05Tribhovandas Bhimji Zaveri Ltd is rated Strong Buy by MarketsMOJO, with this rating last updated on 08 July 2026. However, the analysis and financial metrics discussed here reflect the company’s current position as of 20 July 2026, providing investors with the most up-to-date insight into the stock’s fundamentals, valuation, financial trends, and technical outlook.
Read full news article
Broad-Based Technical Strength Lifts Tribhovandas Bhimji Zaveri Ltd to 52-Week High of Rs 266.95
2026-07-15 09:42:06With a decisive break above Rs 266.95 on 15 Jul 2026, Tribhovandas Bhimji Zaveri Ltd has reached a fresh 52-week high, extending its impressive 33.24% gain over the past year. This milestone reflects a confluence of strong technical momentum and robust earnings growth, setting the stock apart in the Gems, Jewellery And Watches sector.
Read full news article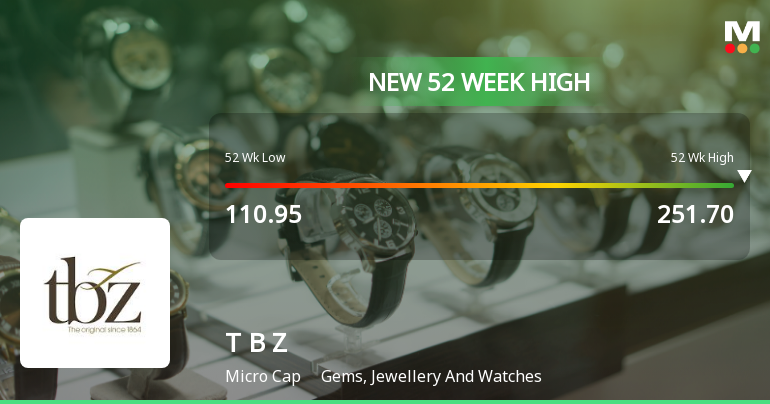
Broad-Based Technical Strength Lifts Tribhovandas Bhimji Zaveri Ltd to 52-Week High of Rs 253.45
2026-07-14 10:40:17Surging to a fresh 52-week high of Rs 253.45 on 14 Jul 2026, Tribhovandas Bhimji Zaveri Ltd has demonstrated robust momentum, outperforming its sector by 12.19% in a single session marked by heightened volatility and strong technical signals.
Read full news article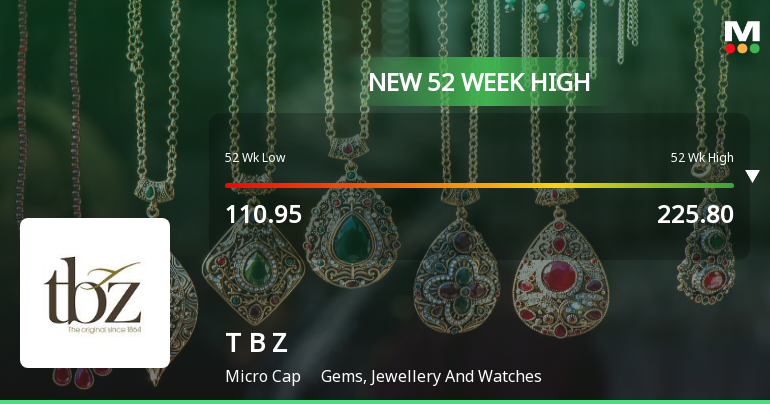
Broad-Based Technical Strength Lifts Tribhovandas Bhimji Zaveri Ltd to 52-Week High of Rs 227.1
2026-07-09 09:43:47With a decisive surge to Rs 227.1 on 09 Jul 2026, Tribhovandas Bhimji Zaveri Ltd has reached a fresh 52-week high, marking a significant milestone in its price momentum. This rally has been fuelled by a confluence of strong technical signals and sustained upward price action, setting the stock apart in the Gems, Jewellery And Watches sector.
Read full news article
Tribhovandas Bhimji Zaveri Ltd Upgraded to Strong Buy on Robust Financials and Bullish Technicals
2026-07-09 08:07:12Tribhovandas Bhimji Zaveri Ltd (TBZ), a micro-cap player in the Gems, Jewellery and Watches sector, has seen its investment rating upgraded from Hold to Strong Buy, reflecting significant improvements across quality, valuation, financial trends, and technical indicators. This upgrade, effective from 8 July 2026, is underpinned by the company’s impressive financial performance, attractive valuation metrics, and a shift to a bullish technical outlook, signalling renewed investor confidence in the stock’s growth prospects.
Read full news article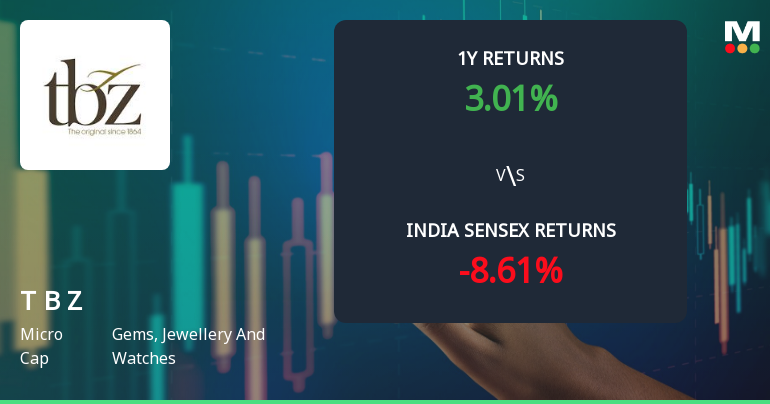
Tribhovandas Bhimji Zaveri Ltd Sees Bullish Momentum Shift Amid Strong Technical Signals
2026-07-09 08:00:54Tribhovandas Bhimji Zaveri Ltd (TBZ), a micro-cap player in the Gems, Jewellery and Watches sector, has exhibited a notable shift in its technical momentum, signalling a bullish phase after a period of sideways movement. With a recent upgrade to a Strong Buy rating and a Mojo Score of 80.0, the stock’s technical indicators and price action suggest a compelling opportunity for investors seeking exposure in this niche segment.
Read full news article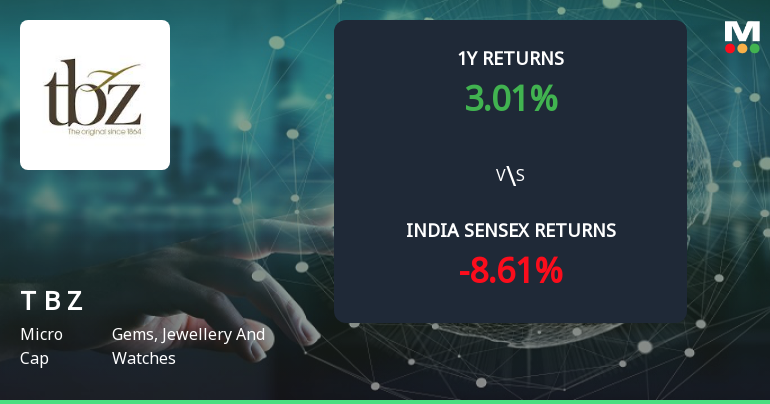
Golden Cross Confirmed: Do Tribhovandas Bhimji Zaveri Ltd's Other Technical Indicators Agree?
2026-07-08 18:20:08The 50-day moving average has crossed above the 200-day moving average for Tribhovandas Bhimji Zaveri Ltd, signalling a golden cross on 8 Jul 2026. While this is a classic technical signal suggesting a shift towards bullish momentum, the broader technical and fundamental context presents a nuanced picture that merits closer examination.
Read full news article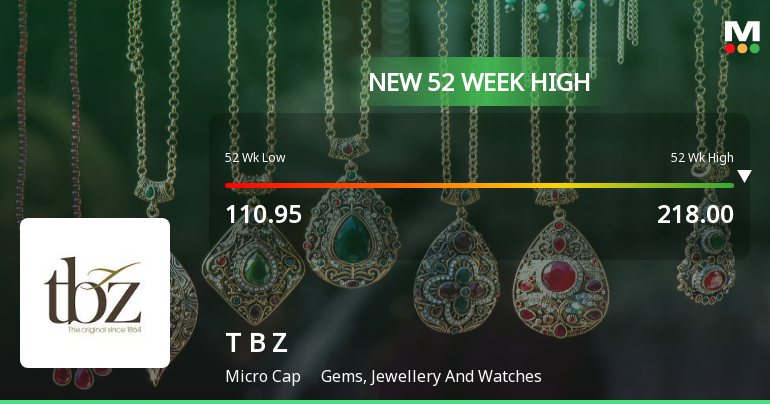
Broad-Based Technical Strength Lifts Tribhovandas Bhimji Zaveri Ltd to 52-Week High of Rs 218.85
2026-07-08 13:10:12With every major technical indicator signalling strength, Tribhovandas Bhimji Zaveri Ltd surged to a fresh 52-week high of Rs 218.85 on 8 Jul 2026, marking a notable milestone in its price momentum despite a broadly weaker market backdrop.
Read full news articleClarification Sought from Tribhovandas Bhimji Zaveri Ltd
08-Jul-2026 | Source : BSEThe Exchange has sought clarification from Tribhovandas Bhimji Zaveri Ltd on July 8 2026 with reference to Movement in Volume.
The reply is awaited.
Clarification Letter For Significant Increase In Volume
08-Jul-2026 | Source : BSEClarification Letter for Significant Increase in Volume
Announcement under Regulation 30 (LODR)-Change in Management
07-Jul-2026 | Source : BSEMr. Sanjay Bilimoria Head - Inventory (Gold) has resigned from the services of the Company
Corporate Actions

No Upcoming Board Meetings

Tribhovandas Bhimji Zaveri Ltd has declared 22% dividend, ex-date: 02 Sep 25

No Splits history available

No Bonus history available

No Rights history available


