


Key Events This Week
May 25: Stock opens at Rs.418.30, gaining 1.78% amid positive market sentiment
May 26: Sharp rally to Rs.443.25 (+5.96%) despite Sensex decline
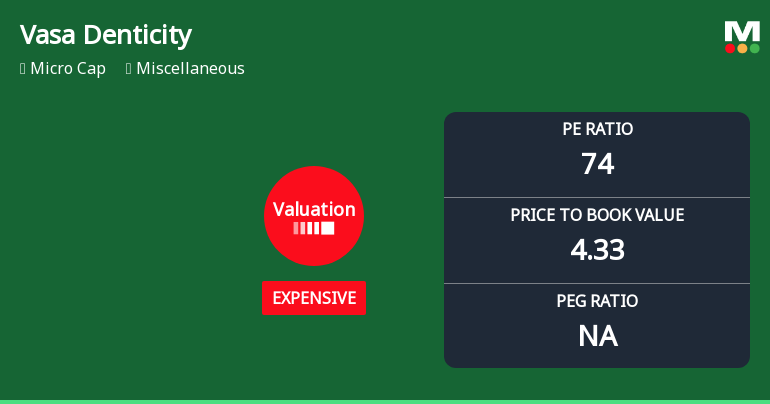
May 27: Q4 FY26 results reveal collapsing margins; valuation concerns emerge
May 29: Stock rebounds to Rs.434.55 (+7.07%) closing the week on a strong note
Are Vasa Denticity Ltd latest results good or bad?
2026-05-28 19:27:37The latest financial results for Vasa Denticity Ltd for Q4 FY26 reveal a complex picture characterized by significant operational challenges despite achieving record net sales. The company reported consolidated net sales of ₹73.26 crores, marking a marginal increase of 1.52% quarter-on-quarter and 0.33% year-on-year, indicating continued market penetration in the dental supplies distribution segment. However, this topline growth is overshadowed by a dramatic decline in profitability metrics. Consolidated net profit for the quarter was ₹1.34 crores, reflecting a year-on-year decrease of 68.17% and a quarter-on-quarter decline of 2.19%. The operating margin, excluding other income, fell to 0.38%, a significant drop from 8.75% in the same quarter last year, indicating severe margin compression and operational inefficiencies. This represents the lowest operating margin in the company's history, highlighting fu...
Read full news article


