
Compare Vasa Denticity with Similar Stocks
Dashboard
Poor Management Efficiency with a low ROE of 9.34%
- The company has been able to generate a Return on Equity (avg) of 9.34% signifying low profitability per unit of shareholders funds
Negative results in Mar 26
Reducing Promoter Confidence
Below par performance in long term as well as near term
Total Returns (Price + Dividend) 
Vasa Denticity for the last several years.
Risk Adjusted Returns v/s
Returns Beta

News
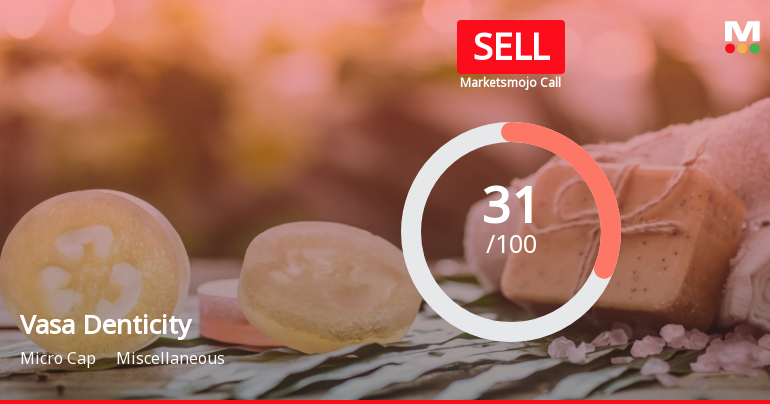
Vasa Denticity Ltd is Rated Sell
Vasa Denticity Ltd is rated 'Sell' by MarketsMOJO, with this rating last updated on 22 June 2026. However, the analysis and financial metrics discussed here reflect the stock's current position as of 26 June 2026, providing investors with the latest insights into the company’s performance and outlook.
Read full news article
Vasa Denticity Ltd Technical Momentum Shifts Amid Bearish Market Sentiment
Vasa Denticity Ltd, a micro-cap player in the miscellaneous sector, has experienced a nuanced shift in its technical momentum, reflecting a complex interplay of bullish and bearish signals. Despite a modest day gain of 1.67% to close at ₹377.15, the stock remains under pressure with a strong sell rating and a deteriorated technical grade, underscoring the challenges ahead for investors.
Read full news article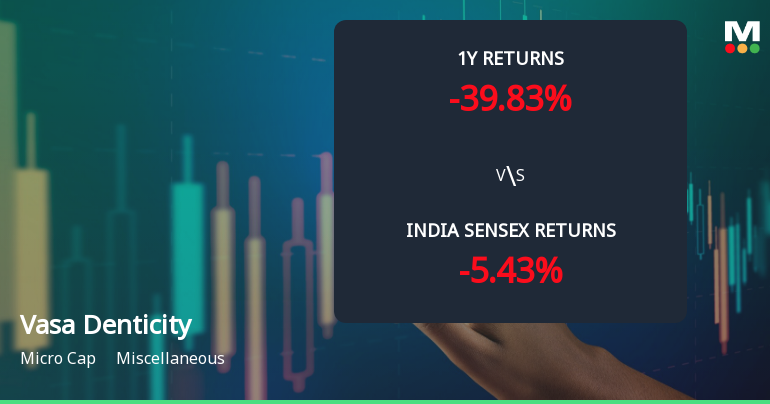
Vasa Denticity Ltd Faces Intensified Downtrend Amid Technical Weakness
Vasa Denticity Ltd, a micro-cap player in the miscellaneous sector, has experienced a notable shift in its technical momentum, signalling increased bearishness. With its MarketsMOJO grade downgraded from Sell to Strong Sell on 17 June 2026, the stock’s technical indicators reveal a deteriorating trend that investors should carefully analyse amid a challenging market backdrop.
Read full news article Announcements
Corporate Actions

No Upcoming Board Meetings

No Dividend history available

No Splits history available

No Bonus history available

No Rights history available
Quality key factors
Valuation key factors
Technicals key factors
 Technical Indicator Scale: Bearish, Mildly Bearish, Sideways, Mildly Bullish, Bullish Turned
 Shareholding Snapshot : Mar 2026
Shareholding Compare (%holding)
Promoters
None
Held by 1 Schemes (0.3%)
Held by 2 FIIs (6.93%)
Vikas Agarwal (36.34%)
Malabar India Fund Limited (5.62%)
27.06%
Quarterly Results Snapshot (Consolidated) - Mar'26 - QoQ

QoQ Growth in quarter ended Mar 2026 is 1.52% vs -1.07% in Dec 2025
QoQ Growth in quarter ended Mar 2026 is -2.19% vs -71.28% in Dec 2025
Half Yearly Results Snapshot (Consolidated) - Mar'26
Growth in half year ended Mar 2026 is 8.96% vs -2.18% in Sep 2025

Growth in half year ended Mar 2026 is -63.83% vs -8.29% in Sep 2025
Nine Monthly Results Snapshot (Consolidated) - Dec'25
YoY Growth in nine months ended Dec 2025 is 16.99% vs 56.12% in Dec 2024
YoY Growth in nine months ended Dec 2025 is -30.27% vs 46.22% in Dec 2024
Annual Results Snapshot (Consolidated) - Mar'26
YoY Growth in year ended Mar 2026 is 11.83% vs 46.92% in Mar 2025
YoY Growth in year ended Mar 2026 is -39.66% vs 12.53% in Mar 2025
About Vasa Denticity Ltd

Company Coordinates


