
Compare Nikhil Adhesives with Similar Stocks
Stock DNA
Specialty Chemicals
INR 386 Cr (Micro Cap)
21.00
41
0.27%
0.44
12.11%
2.60
Total Returns (Price + Dividend) 
Latest dividend: 0.22 per share ex-dividend date: Sep-16-2025
Risk Adjusted Returns v/s
Returns Beta

News
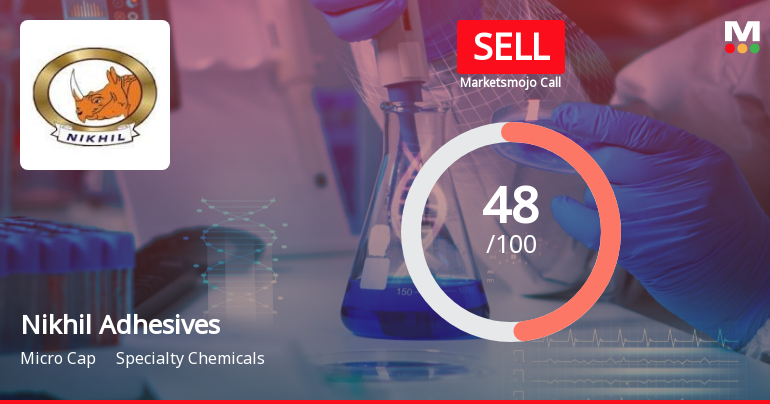
Nikhil Adhesives Ltd is Rated Sell
Nikhil Adhesives Ltd is rated 'Sell' by MarketsMOJO, with this rating last updated on 26 May 2026. However, the analysis and financial metrics discussed here reflect the stock's current position as of 10 June 2026, providing investors with the latest insights into its performance and outlook.
Read full news article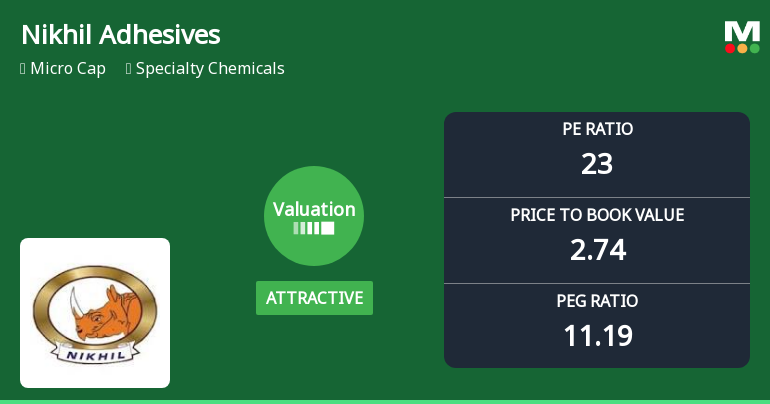
Nikhil Adhesives Ltd Valuation Shifts Signal Renewed Price Attractiveness
Nikhil Adhesives Ltd has witnessed a notable shift in its valuation parameters, moving from a fair to an attractive rating, despite a recent downgrade in its overall Mojo Grade to Sell. This change is underpinned by a recalibration of key multiples such as the price-to-earnings (P/E) and price-to-book value (P/BV) ratios, positioning the micro-cap specialty chemicals firm as a potentially compelling opportunity for value-focused investors amid a volatile sector backdrop.
Read full news article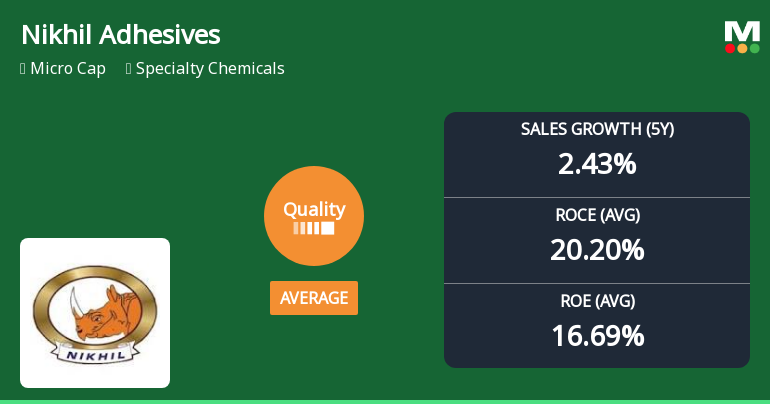
Nikhil Adhesives Ltd Quality Grade Downgrade: A Detailed Analysis of Business Fundamentals
Nikhil Adhesives Ltd, a micro-cap player in the specialty chemicals sector, has seen its quality grade downgraded from good to average, accompanied by a Mojo Grade shift from Hold to Sell as of 26 May 2026. This change reflects a nuanced deterioration in certain business fundamentals despite some enduring strengths, raising questions about the company’s medium-term growth and financial health.
Read full news article Announcements
Compliances-Reg.24(A)-Annual Secretarial Compliance
30-May-2026 | Source : BSEAnnual Secretarial Compliance Report for the year ended on 31st March 2026
Announcement under Regulation 30 (LODR)-Newspaper Publication
29-May-2026 | Source : BSENewspaper Advertisement for Audited Financial Results for Quarter & Financial Year ended on 31st March 2026
Board Meeting Intimation for Intimation Of Board Meeting Under Regulations 29 Of The SEBI (Listing Obligations And Disclosure Requirements) Regulations 2015.
19-May-2026 | Source : BSENikhil Adhesives Ltd-has informed BSE that the meeting of the Board of Directors of the Company is scheduled on 27/05/2026 inter alia to consider and approve Intimation of Board Meeting under Regulations 29 of the SEBI (Listing Obligations and Disclosure Requirements) Regulations 2015 to consider and approve the following transactions: a. To consider and approve the Audited Financial Results along with the Auditors report thereon for the quarter and financial year ended on 31st March 2026; b. To recommend Dividend if any on the Equity shares of the Company for the financial year 2025-26;
Corporate Actions

No Upcoming Board Meetings

Nikhil Adhesives Ltd has declared 22% dividend, ex-date: 16 Sep 25

Nikhil Adhesives Ltd has announced 1:10 stock split, ex-date: 12 Oct 22

No Bonus history available

No Rights history available
Quality key factors
Valuation key factors
Technicals key factors
 Technical Indicator Scale: Bearish, Mildly Bearish, Sideways, Mildly Bullish, Bullish Turned
 Shareholding Snapshot : Mar 2026
Shareholding Compare (%holding)
Promoters
None
Held by 0 Schemes
Held by 0 FIIs
Rekha Tarak Sanghavi (10.55%)
Vasant Polymers & Chemicals Pvt. Ltd. (10.96%)
26.94%
Quarterly Results Snapshot (Standalone) - Mar'26 - QoQ

QoQ Growth in quarter ended Mar 2026 is 24.72% vs 1.54% in Dec 2025
QoQ Growth in quarter ended Mar 2026 is 78.41% vs -11.78% in Dec 2025
Half Yearly Results Snapshot (Standalone) - Sep'25

Growth in half year ended Sep 2025 is -17.59% vs 8.03% in Sep 2024
Growth in half year ended Sep 2025 is -14.11% vs 40.18% in Sep 2024
Nine Monthly Results Snapshot (Standalone) - Dec'25
YoY Growth in nine months ended Dec 2025 is -12.52% vs 6.46% in Dec 2024
YoY Growth in nine months ended Dec 2025 is -9.83% vs 33.02% in Dec 2024
Annual Results Snapshot (Standalone) - Mar'26
YoY Growth in year ended Mar 2026 is -6.52% vs 4.96% in Mar 2025
YoY Growth in year ended Mar 2026 is 4.26% vs 25.66% in Mar 2025
About Nikhil Adhesives Ltd

Company Coordinates


