
Compare Vipul Organics with Similar Stocks
Dashboard
Poor long term growth as Net Sales has grown by an annual rate of 8.12% and Operating profit at 1.17% over the last 5 years
With a growth in Net Profit of 152.56%, the company declared Very Positive results in Mar 26
With ROCE of 7.7, it has a Expensive valuation with a 4 Enterprise value to Capital Employed
Despite the size of the company, domestic mutual funds hold only 0% of the company
Stock DNA
Specialty Chemicals
INR 510 Cr (Micro Cap)
77.00
20
0.27%
0.20
5.90%
4.54
Total Returns (Price + Dividend) 
Latest dividend: 0.8 per share ex-dividend date: Sep-23-2025
Risk Adjusted Returns v/s
Returns Beta

News
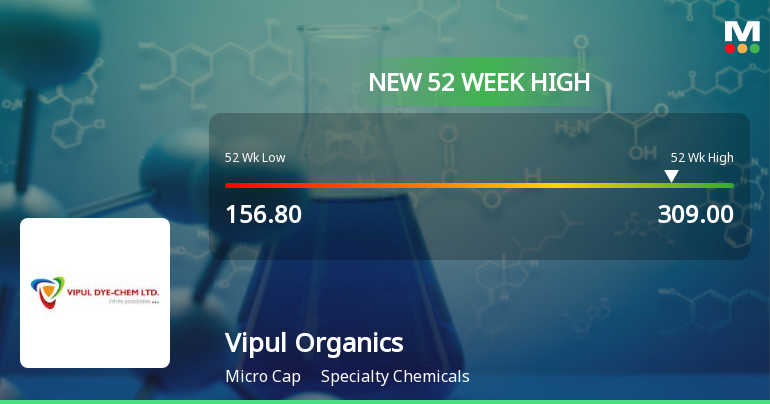
Broad-Based Technical Strength Lifts Vipul Organics Ltd to 52-Week High of Rs 309
With a sustained six-day rally delivering a 46.62% gain, Vipul Organics Ltd surged to a fresh 52-week high of Rs 309 on 09 Jun 2026, outpacing its specialty chemicals sector peers and the broader market.
Read full news article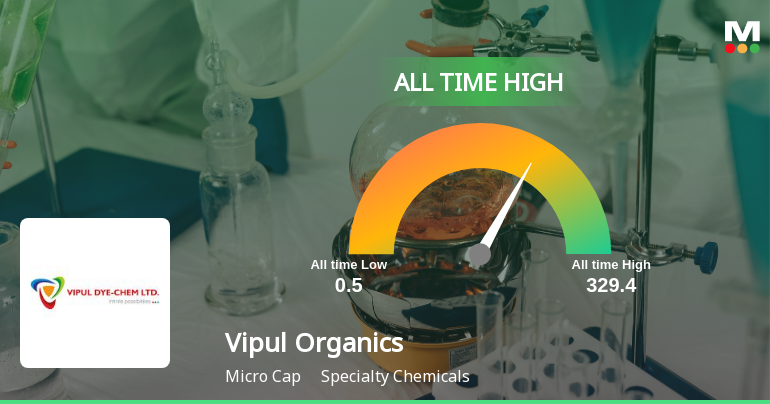
Vipul Organics Ltd Hits All-Time High of Rs 309 as Momentum Builds Across Timeframes
Extending its winning streak to six consecutive sessions, Vipul Organics Ltd surged to a fresh all-time high of Rs 309 on 09 Jun 2026, marking a remarkable 42.83% gain over this period. This rally has outpaced the broader Sensex, which declined by 1.03% over the past week, underscoring the stock’s strong relative performance in the Specialty Chemicals sector.
Read full news article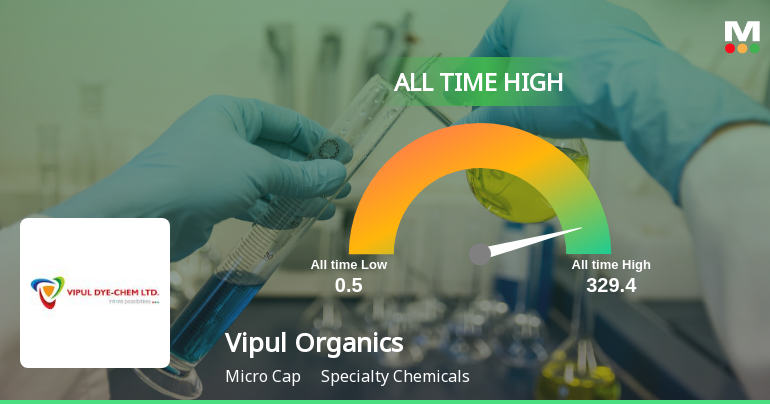
Vipul Organics Ltd Hits All-Time High of Rs 265 as Momentum Builds Across Timeframes
Extending its winning streak to five consecutive sessions, Vipul Organics Ltd surged 11.43% on 8 Jun 2026 to touch a fresh all-time high of Rs 265, significantly outperforming the Sensex which declined 0.71% on the same day.
Read full news article Announcements
Company Presentation For Exclusive Conference Scheduled On Saturday 06Th June 2026
05-Jun-2026 | Source : BSEThis is further to our communication dated May 20 2026 regarding receipt of an invitation by the Company for an Exclusive Conference which will be jointly hosted by the Ashika Group and CNI Infoxchange offering an opportunity to the Investor Community to interact with the Management team of our Company to be Scheduled on Saturday 6th June 2026 between 10.00 a.m. to 3.00 p.m. at Altimus Level 35 Dr. G.M. Bhosale Marg Worli Mumbai - 400018
Announcement under Regulation 30 (LODR)-Newspaper Publication
01-Jun-2026 | Source : BSEAs per Attachment
Announcement under Regulation 30 (LODR)-Press Release / Media Release
01-Jun-2026 | Source : BSEAs per Attachment
Corporate Actions

No Upcoming Board Meetings

Vipul Organics Ltd has declared 8% dividend, ex-date: 23 Sep 25

No Splits history available

Vipul Organics Ltd has announced 1:4 bonus issue, ex-date: 07 Apr 22

No Rights history available
Quality key factors
Valuation key factors
Technicals key factors
 Technical Indicator Scale: Bearish, Mildly Bearish, Sideways, Mildly Bullish, Bullish Turned
 Shareholding Snapshot : Mar 2026
Shareholding Compare (%holding)
Promoters
None
Held by 1 Schemes (0.0%)
Held by 1 FIIs (0.17%)
Vipul Pravinchandra Shah (24.68%)
Mehul Madhusudan Shah (3.15%)
28.32%
Quarterly Results Snapshot (Consolidated) - Mar'26 - YoY

YoY Growth in quarter ended Mar 2026 is 18.44% vs 10.25% in Mar 2025
YoY Growth in quarter ended Mar 2026 is 150.63% vs -26.17% in Mar 2025
Half Yearly Results Snapshot (Consolidated) - Sep'25

Growth in half year ended Sep 2025 is -0.35% vs 6.37% in Sep 2024
Growth in half year ended Sep 2025 is 40.00% vs 49.66% in Sep 2024
Nine Monthly Results Snapshot (Consolidated) - Dec'25
YoY Growth in nine months ended Dec 2025 is 3.76% vs 7.83% in Dec 2024
YoY Growth in nine months ended Dec 2025 is 35.07% vs 60.79% in Dec 2024
Annual Results Snapshot (Consolidated) - Mar'26
YoY Growth in year ended Mar 2026 is 7.74% vs 8.48% in Mar 2025
YoY Growth in year ended Mar 2026 is 55.98% vs 32.63% in Mar 2025
About Vipul Organics Ltd

Company Coordinates


