
Compare Nilkamal Ltd with Similar Stocks
Stock DNA
Diversified consumer products
INR 1,925 Cr (Small Cap)
15.00
36
1.55%
0.20
8.08%
1.22
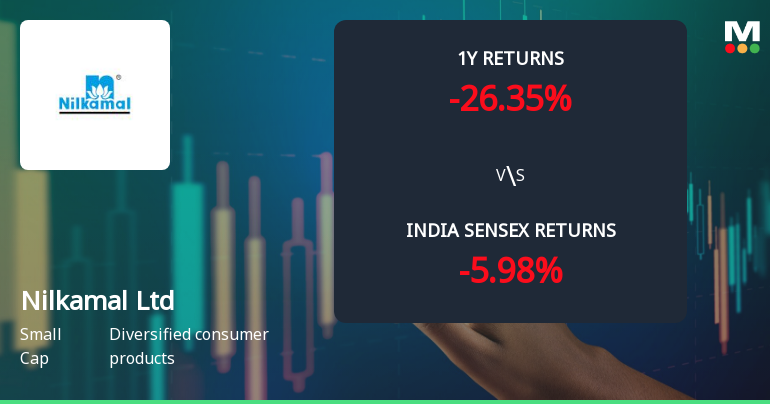
Total Returns (Price + Dividend) 
Latest dividend: 20 per share ex-dividend date: Jul-11-2025
Risk Adjusted Returns v/s
Returns Beta

News
Nilkamal Ltd Technical Momentum Shifts Amid Mixed Market Signals
Nilkamal Ltd, a small-cap player in the diversified consumer products sector, has exhibited a subtle shift in its technical momentum, moving from a bearish to a mildly bearish stance. Despite a modest day gain of 1.06% to close at ₹1,283.50, the stock’s broader technical indicators present a complex picture, reflecting mixed signals across weekly and monthly timeframes.
Read full news article
Nilkamal Ltd is Rated Sell by MarketsMOJO
Nilkamal Ltd is rated 'Sell' by MarketsMOJO, with this rating last updated on 15 Apr 2025. However, the analysis and financial metrics discussed here reflect the stock's current position as of 14 June 2026, providing investors with an up-to-date perspective on the company’s performance and outlook.
Read full news article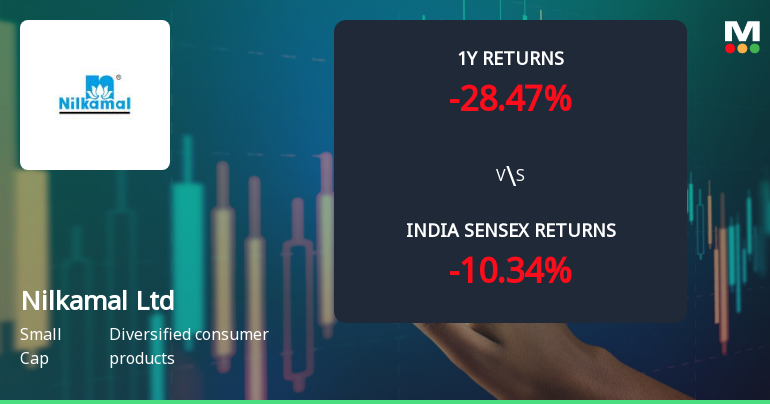
Nilkamal Ltd Technical Momentum Shifts Amid Bearish Sentiment
Nilkamal Ltd, a small-cap player in the diversified consumer products sector, has experienced a notable shift in its technical momentum, moving from a mildly bearish stance to a more pronounced bearish trend. Despite some mildly bullish weekly signals, the overall technical indicators suggest caution for investors as the stock continues to underperform relative to the broader market benchmarks.
Read full news article Announcements
Announcement under Regulation 30 (LODR)-Newspaper Publication
19-Jun-2026 | Source : BSENewspaper adverisement for 40th Annual General Meeting to be held on July 17 2026.
Announcement under Regulation 30 (LODR)-Newspaper Publication
11-Jun-2026 | Source : BSENewpaper adevertisement regarding special window for re-lodgement of Transfer Request of Physical Shares.
Compliances-Reg.24(A)-Annual Secretarial Compliance
20-May-2026 | Source : BSEAnnual Secretarial Compliance Report for the financial year ended March 31 2026.
Corporate Actions

No Upcoming Board Meetings

Nilkamal Ltd has declared 200% dividend, ex-date: 10 Jul 26

No Splits history available

No Bonus history available

No Rights history available
Quality key factors
Valuation key factors
Technicals key factors
 Technical Indicator Scale: Bearish, Mildly Bearish, Sideways, Mildly Bullish, Bullish Turned
 Shareholding Snapshot : Mar 2026
Shareholding Compare (%holding)
Promoters
None
Held by 4 Schemes (13.72%)
Held by 37 FIIs (0.98%)
Nayan S. Parekh (14.76%)
Dsp Small Cap Fund (7.9%)
17.41%
Quarterly Results Snapshot (Consolidated) - Mar'26 - YoY

YoY Growth in quarter ended Mar 2026 is 7.96% vs 7.17% in Mar 2025
YoY Growth in quarter ended Mar 2026 is 21.65% vs -3.89% in Mar 2025
Half Yearly Results Snapshot (Consolidated) - Sep'25
Growth in half year ended Sep 2025 is 18.31% vs 0.37% in Sep 2024
Growth in half year ended Sep 2025 is -3.94% vs -11.54% in Sep 2024
Nine Monthly Results Snapshot (Consolidated) - Dec'25
YoY Growth in nine months ended Dec 2025 is 16.30% vs 2.40% in Dec 2024
YoY Growth in nine months ended Dec 2025 is 2.45% vs -16.65% in Dec 2024
Annual Results Snapshot (Consolidated) - Mar'26
YoY Growth in year ended Mar 2026 is 14.05% vs 3.64% in Mar 2025
YoY Growth in year ended Mar 2026 is 8.60% vs -12.94% in Mar 2025
About Nilkamal Ltd

Company Coordinates


