
Compare Nilkamal Ltd with Similar Stocks
Dashboard
Strong ability to service debt as the company has a low Debt to EBITDA ratio of 1.27 times
Poor long term growth as Net Sales has grown by an annual rate of 12.55% and Operating profit at 3.68% over the last 5 years
Positive results in Mar 26
With ROCE of 9.9, it has a Very Attractive valuation with a 1.6 Enterprise value to Capital Employed
Falling Participation by Institutional Investors
Stock DNA
Diversified consumer products
INR 2,740 Cr (Small Cap)
21.00
20
1.12%
0.20
8.08%
1.69
Total Returns (Price + Dividend) 
Latest dividend: 20.024566252111164 per share ex-dividend date: Jul-10-2026
Risk Adjusted Returns v/s
Returns Beta

News

Nilkamal Ltd Surges 7.59% to Day's High of Rs 1917.9 — Outperforms Sector by 7.76 Percentage Points
The Sensex edged down 0.08% on 28 Jul 2026, while Nilkamal Ltd surged 7.59%, touching an intraday high of Rs 1917.9. This 7.76 percentage-point outperformance over its sector highlights a distinctly stock-specific rally that rewrites the short-term narrative for this diversified consumer products player.
Read full news article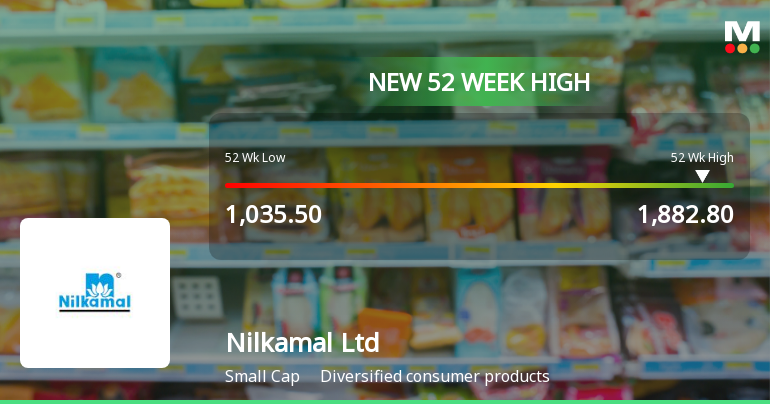
Broad-Based Technical Strength Lifts Nilkamal Ltd to 52-Week High of Rs 1882.8
With a sustained eight-day rally culminating in a fresh 52-week high of Rs 1882.8 on 28 Jul 2026, Nilkamal Ltd has demonstrated remarkable price momentum, outpacing its sector and the broader market despite a subdued Sensex. This milestone reflects a confluence of technical signals that have aligned to propel the stock higher.
Read full news article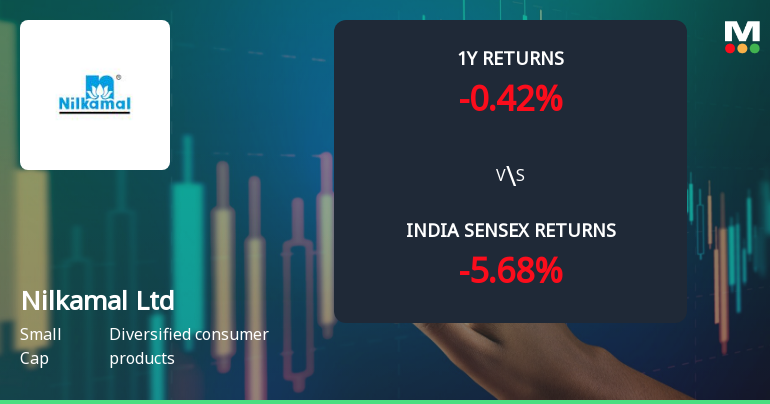
Nilkamal Ltd Technical Momentum Shifts Amid Mixed Indicator Signals
Nilkamal Ltd has witnessed a notable shift in its technical momentum, moving from a mildly bullish stance to a sideways trend, reflecting a complex interplay of indicator signals. Despite a strong day gain of 5.88%, the stock’s technical parameters reveal a nuanced picture that investors should carefully analyse amid broader market conditions.
Read full news article Announcements
Board Meeting Intimation for Consideration Of Unaudited Financial Results (Standalone & Consolidated) For The First Quarter Ended June 30 2026
24-Jul-2026 | Source : BSENilkamal Ltdhas informed BSE that the meeting of the Board of Directors of the Company is scheduled on 01/08/2026 inter alia to consider and approve Unaudited Financial Result (standalone & Consolidated) for the First Quarter Ended June 30 2026.
Shareholder Meeting / Postal Ballot-Outcome of AGM
17-Jul-2026 | Source : BSEPlease find attached proceeding of 40th AGM along with Voting Result.
Chairman Statement Made At The 40Th Annual General Meeting Of The Company Held On Friday July 17 2026.
17-Jul-2026 | Source : BSEChairman Statement made at the 40th Annual General Meeting of the Company held on Friday July 17 2026.
Corporate Actions

01 Aug 2026

Nilkamal Ltd has declared 200% dividend, ex-date: 10 Jul 26

No Splits history available

No Bonus history available

No Rights history available
Quality key factors
Valuation key factors
Technicals key factors
 Technical Indicator Scale: Bearish, Mildly Bearish, Sideways, Mildly Bullish, Bullish Turned
 Shareholding Snapshot : Jun 2026
Shareholding Compare (%holding)
Promoters
None
Held by 4 Schemes (12.9%)
Held by 35 FIIs (0.97%)
Nayan S. Parekh (14.76%)
Dsp Small Cap Fund (7.9%)
18.16%
Quarterly Results Snapshot (Consolidated) - Mar'26 - YoY

YoY Growth in quarter ended Mar 2026 is 7.96% vs 7.17% in Mar 2025
YoY Growth in quarter ended Mar 2026 is 21.65% vs -3.89% in Mar 2025
Half Yearly Results Snapshot (Consolidated) - Sep'25
Growth in half year ended Sep 2025 is 18.31% vs 0.37% in Sep 2024
Growth in half year ended Sep 2025 is -3.94% vs -11.54% in Sep 2024
Nine Monthly Results Snapshot (Consolidated) - Dec'25
YoY Growth in nine months ended Dec 2025 is 16.30% vs 2.40% in Dec 2024
YoY Growth in nine months ended Dec 2025 is 2.45% vs -16.65% in Dec 2024
Annual Results Snapshot (Consolidated) - Mar'26
YoY Growth in year ended Mar 2026 is 14.05% vs 3.64% in Mar 2025
YoY Growth in year ended Mar 2026 is 8.60% vs -12.94% in Mar 2025
About Nilkamal Ltd

Company Coordinates


