
Compare Nimbus Projects with Similar Stocks
Dashboard
With a Operating Losses, the company has a Weak Long Term Fundamental Strength
- Poor long term growth as Operating profit has grown by an annual rate -204.69% of over the last 5 years
- Low ability to service debt as the company has a high Debt to EBITDA ratio of -4.34 times
Flat results in Mar 26
Risky - Negative EBITDA
Total Returns (Price + Dividend) 
Nimbus Projects for the last several years.
Risk Adjusted Returns v/s
Returns Beta

News
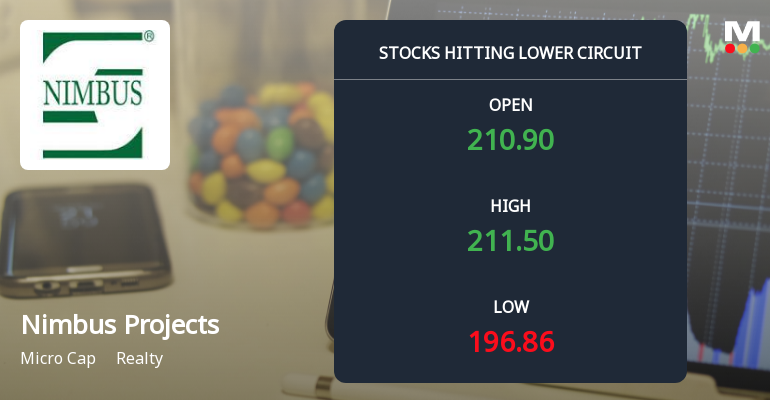
Below All Moving Averages and Now at Lower Circuit: Nimbus Projects Ltd Loses 5% in a Single Session
At Rs 196.86, sellers were still queuing — but there were no buyers willing to take the other side. Nimbus Projects Ltd locked at its lower circuit of 5% on 16 Jun 2026, with unfilled sell orders and a frozen price, signalling a day of pronounced selling pressure in this micro-cap realty stock.
Read full news article
Below All Moving Averages and Now at Lower Circuit: Nimbus Projects Ltd Loses 0.33% in a Single Session
At Rs 209.1, sellers were still queuing — but there were no buyers willing to take the other side. Nimbus Projects Ltd locked at its lower circuit of 5% on 10 Jun 2026, with unfilled sell orders and a frozen price, signalling persistent selling pressure in a micro-cap stock with limited liquidity.
Read full news article
Nimbus Projects Ltd is Rated Strong Sell
Nimbus Projects Ltd is rated Strong Sell by MarketsMOJO. This rating was last updated on 18 Nov 2025. However, the analysis and financial metrics discussed below reflect the stock’s current position as of 10 June 2026, providing investors with the latest insights into the company’s performance and outlook.
Read full news article Announcements
Intimation Regarding Submission Of Application To The Stock Exchanges For Reclassification Of Persons Forming Part Of The Promoter/ Promoter Group Category To The Public Category
30-May-2026 | Source : BSEIntimation regarding submission of application to the Stock Exchanges for Reclassification of Persons forming part of the Promoter/ Promoter Group category to the Public category
Announcement under Regulation 30 (LODR)-Newspaper Publication
29-May-2026 | Source : BSENewspaper Publication for Audited Financial Results (Standalone & Consolidated) for the quarter & year ended 31.03.2026
Compliances-Reg.24(A)-Annual Secretarial Compliance
28-May-2026 | Source : BSEAnnual Secretarial Compliance Report under Regulation 24A of SEBI (Listing Obligations and Disclosure Requirements) 2015 for the financial year ended March 31 2026
Corporate Actions

No Upcoming Board Meetings

No Dividend history available

No Splits history available

No Bonus history available

No Rights history available
Quality key factors
Valuation key factors
Technicals key factors
 Technical Indicator Scale: Bearish, Mildly Bearish, Sideways, Mildly Bullish, Bullish Turned
 Shareholding Snapshot : Apr 2026
Shareholding Compare (%holding)
Promoters
None
Held by 0 Schemes
Held by 1 FIIs (0.03%)
Anamica Financial Services Private Limited (9.81%)
Peanence Commercial Pvt Limited (7.04%)
16.99%
Quarterly Results Snapshot (Consolidated) - Mar'26 - QoQ

QoQ Growth in quarter ended Mar 2026 is 9,556.19% vs -48.28% in Dec 2025
QoQ Growth in quarter ended Mar 2026 is 61.12% vs -334.54% in Dec 2025
Half Yearly Results Snapshot (Consolidated) - Sep'25

Growth in half year ended Sep 2025 is -95.28% vs 18,350.53% in Sep 2024
Growth in half year ended Sep 2025 is -111.25% vs 5,487.70% in Sep 2024
Nine Monthly Results Snapshot (Consolidated) - Dec'25
YoY Growth in nine months ended Dec 2025 is -94.07% vs 18,195.88% in Dec 2024
YoY Growth in nine months ended Dec 2025 is -133.90% vs 3,178.44% in Dec 2024
Annual Results Snapshot (Consolidated) - Mar'26
YoY Growth in year ended Mar 2026 is 28.30% vs 2,383.29% in Mar 2025
YoY Growth in year ended Mar 2026 is -208.37% vs -32.42% in Mar 2025
About Nimbus Projects Ltd

Company Coordinates


