
Compare Norben Tea with Similar Stocks
Dashboard
With a Operating Losses, the company has a Weak Long Term Fundamental Strength
- Low ability to service debt as the company has a high Debt to EBITDA ratio of 8.59 times
- The company has been able to generate a Return on Equity (avg) of 0.72% signifying low profitability per unit of shareholders funds
Flat results in Mar 26
With ROCE of 0.9, it has a Very Expensive valuation with a 4.1 Enterprise value to Capital Employed
Total Returns (Price + Dividend) 
Norben Tea for the last several years.
Risk Adjusted Returns v/s
Returns Beta

News

Norben Tea & Exports Ltd is Rated Strong Sell
Norben Tea & Exports Ltd is rated Strong Sell by MarketsMOJO, with this rating last updated on 17 June 2026. However, the analysis and financial metrics discussed here reflect the stock’s current position as of 21 July 2026, providing investors with an up-to-date view of the company’s fundamentals, valuation, financial trend, and technical outlook.
Read full news article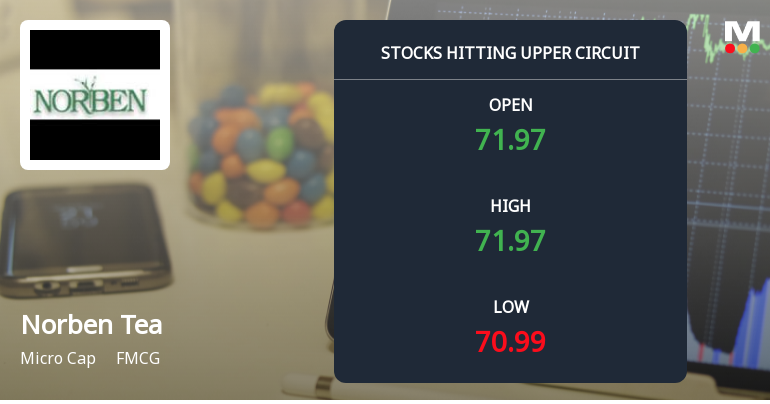
Norben Tea & Exports Ltd Locks at Upper Circuit With 3.56% Gain — Buyers Queue, Sellers Absent
At Rs 71.97, the buying was done — not because demand dried up, but because the exchange wouldn't let the stock go any higher. Norben Tea & Exports Ltd locked at its upper circuit of 3.56% on 21 Jul 2026, with buyers queuing and no sellers willing to part with shares.
Read full news article
Norben Tea & Exports Ltd is Rated Strong Sell
Norben Tea & Exports Ltd is rated Strong Sell by MarketsMOJO. This rating was last updated on 17 June 2026. However, all fundamentals, returns, and financial metrics discussed here reflect the stock's current position as of 10 July 2026, providing investors with the latest comprehensive analysis.
Read full news article Announcements
Norben Tea & Exports Limited - Clarification - Financial Results
26-Nov-2019 | Source : NSENorben Tea & Exports Limited & Exports Limited for the quarter ended 30-Sep-2019 with respect to Regulation 33 of the SEBI (Listing Obligations and Disclosure Requirements) Regulations, 2015.
Norben Tea & Exports Limited - Appointment
13-Nov-2019 | Source : NSENorben Tea & Exports Limited has informed the Exchange regarding Appointment of Mr BALKRISHAN AGARWAL as Non- Executive Director of the company w.e.f. November 11, 2019.
Financial Result Updates
13-Aug-2019 | Source : NSE
| Norben Tea & Exports Limited has submitted to the Exchange, the financial results for the period ended June 30, 2019. |
Corporate Actions

No Upcoming Board Meetings

No Dividend history available

No Splits history available

No Bonus history available

No Rights history available
Quality key factors
Valuation key factors
Technicals key factors
 Technical Indicator Scale: Bearish, Mildly Bearish, Sideways, Mildly Bullish, Bullish Turned
 Shareholding Snapshot : Jun 2026
Shareholding Compare (%holding)
Non Institution
None
Held by 3 Schemes (0.09%)
Held by 1 FIIs (0.09%)
Tongani Tea Company Limited (14.54%)
Kailash Dhanuka Huf (4.99%)
49.95%
Quarterly Results Snapshot (Standalone) - Mar'26 - QoQ

QoQ Growth in quarter ended Mar 2026 is -52.65% vs 26.36% in Dec 2025
QoQ Growth in quarter ended Mar 2026 is -977.78% vs -18.18% in Dec 2025
Half Yearly Results Snapshot (Standalone) - Sep'25
Growth in half year ended Sep 2025 is -20.44% vs 14.04% in Sep 2024
Growth in half year ended Sep 2025 is -60.00% vs 25.00% in Sep 2024
Nine Monthly Results Snapshot (Standalone) - Dec'25
YoY Growth in nine months ended Dec 2025 is 1.07% vs 21.89% in Dec 2024
YoY Growth in nine months ended Dec 2025 is -42.35% vs 226.87% in Dec 2024
Annual Results Snapshot (Standalone) - Mar'26
YoY Growth in year ended Mar 2026 is 5.49% vs 16.26% in Mar 2025
YoY Growth in year ended Mar 2026 is -61.11% vs 89.41% in Mar 2025
About Norben Tea & Exports Ltd

Company Coordinates


