
Compare Norris Medicines with Similar Stocks
Dashboard
With a Negative Book Value, the company has a Weak Long Term Fundamental Strength
- Poor long term growth as Net Sales has grown by an annual rate of -7.83% and Operating profit at 0% over the last 5 years
- The company has a negative book value of Rs 14.86 crore
Risky - Negative Book Value
Below par performance in long term as well as near term
Stock DNA
Trading & Distributors
INR 14 Cr (Micro Cap)
NA (Loss Making)
34
0.00%
-1.45
1.88%
-0.95
Total Returns (Price + Dividend) 
Norris Medicines for the last several years.
Risk Adjusted Returns v/s
Returns Beta

News
Are Norris Medicines Ltd latest results good or bad?
Norris Medicines Ltd's latest financial results for Q4 FY26 present a complex picture of operational performance. The company reported a net profit of ₹0.05 crore, a notable recovery from a loss in the same quarter last year. However, this profitability comes amidst significant revenue challenges, with net sales declining to ₹1.41 crores, representing a substantial decrease of 48.16% year-on-year and a dramatic 56.88% drop from the previous quarter. The operating margin showed a remarkable improvement, rising to 21.99% compared to just 2.57% in Q4 FY25, indicating effective cost management despite the revenue contraction. This margin expansion raises questions about the sustainability of profitability, as it appears primarily driven by cost containment rather than revenue growth. The company's financial position remains precarious, with a negative book value of ₹14.98 per share, reflecting accumulated los...
Read full news article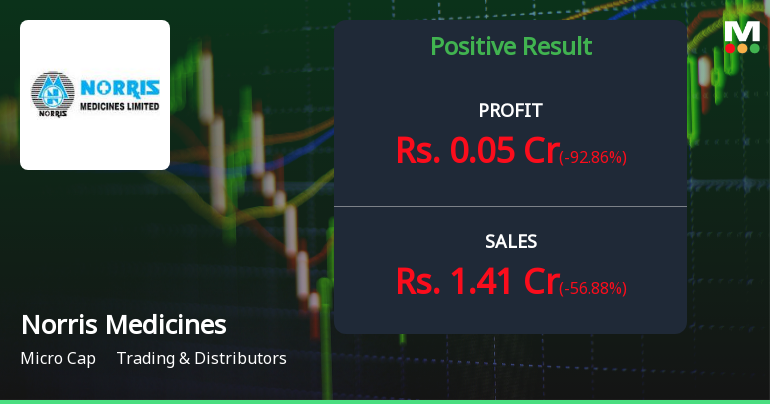
Norris Medicines Q4 FY26: Micro-Cap Pharma Trader Posts Surprise Profit Amid Severe Revenue Decline
Norris Medicines Limited, a micro-cap pharmaceutical trading and distribution company, reported a net profit of ₹0.05 crores for Q4 FY26 (January-March 2026), marking a dramatic reversal from the ₹0.23 crore loss recorded in the same quarter last year. However, this profitability came against a backdrop of severe revenue contraction, with quarterly net sales plummeting 48.16% year-on-year to ₹1.41 crores. The company's shares, trading at ₹13.25 with a market capitalisation of just ₹14.00 crores, remain under significant pressure as investors grapple with the sustainability of this turnaround.
Read full news article Announcements
Outcome Of Board Meeting Held Today I.E. 30Th May 2026.
30-May-2026 | Source : BSEAs per attachment.
Board Meeting Outcome for Outcome Of Board Meeting Held Today I.E. 30Th May 2026.
30-May-2026 | Source : BSEAs per attachment.
Announcement under Regulation 30 (LODR)-Change in Management
30-May-2026 | Source : BSEAppointment of Internal Auditor w.e.f 30.05.2026
Corporate Actions

No Upcoming Board Meetings

No Dividend history available

No Splits history available

No Bonus history available

No Rights history available
Quality key factors
Valuation key factors
Technicals key factors
 Technical Indicator Scale: Bearish, Mildly Bearish, Sideways, Mildly Bullish, Bullish Turned
 Shareholding Snapshot : Mar 2026
Shareholding Compare (%holding)
Non Institution
None
Held by 2 Schemes (0.01%)
Held by 0 FIIs
Vimal D Shah (23.6%)
Lkp Securities Limited (1.5%)
20.78%
Quarterly Results Snapshot (Standalone) - Mar'26 - QoQ

QoQ Growth in quarter ended Mar 2026 is -56.88% vs 63.50% in Dec 2025
QoQ Growth in quarter ended Mar 2026 is -92.86% vs 197.22% in Dec 2025
Half Yearly Results Snapshot (Standalone) - Sep'25

Growth in half year ended Sep 2025 is 73.87% vs -43.14% in Sep 2024
Growth in half year ended Sep 2025 is -41.10% vs 33.03% in Sep 2024
Nine Monthly Results Snapshot (Standalone) - Dec'25
YoY Growth in nine months ended Dec 2025 is 117.10% vs -25.30% in Dec 2024
YoY Growth in nine months ended Dec 2025 is 67.33% vs 25.74% in Dec 2024
Annual Results Snapshot (Standalone) - Mar'26
YoY Growth in year ended Mar 2026 is 39.69% vs 3.19% in Mar 2025
YoY Growth in year ended Mar 2026 is 77.42% vs -4.20% in Mar 2025
About Norris Medicines Ltd

Company Coordinates


