
Compare NTC Industries with Similar Stocks
Dashboard
Low ability to service debt as the company has a high Debt to EBITDA ratio of 3.59 times
- Poor long term growth as Operating profit has grown by an annual rate 17.36% of over the last 5 years
- Low ability to service debt as the company has a high Debt to EBITDA ratio of 3.59 times
- The company has been able to generate a Return on Equity (avg) of 8.09% signifying low profitability per unit of shareholders funds
With a growth in Net Sales of 33.69%, the company declared Outstanding results in Mar 26
With ROCE of 7, it has a Very Attractive valuation with a 1 Enterprise value to Capital Employed
Total Returns (Price + Dividend) 
Latest dividend: 0.5000 per share ex-dividend date: Sep-10-2009
Risk Adjusted Returns v/s
Returns Beta

News

NTC Industries Ltd is Rated Hold
NTC Industries Ltd is rated 'Hold' by MarketsMOJO, a rating that was last updated on 31 May 2025. However, the analysis and financial metrics discussed here reflect the stock’s current position as of 11 June 2026, providing investors with an up-to-date perspective on the company’s fundamentals, valuation, financial trends, and technical outlook.
Read full news article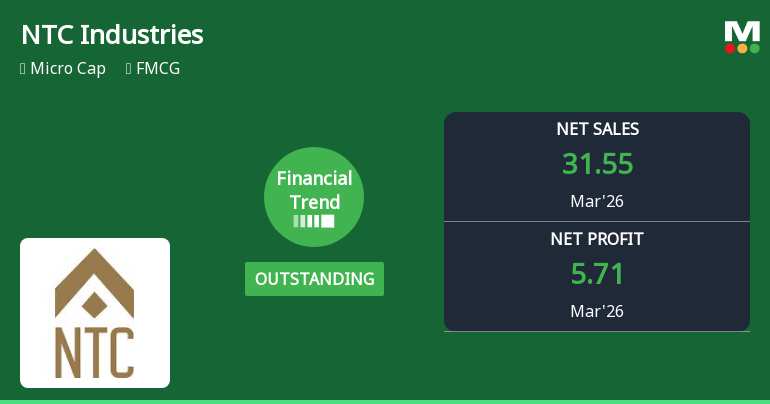
NTC Industries Ltd Reports Outstanding Q4 2026 Performance Amid Shifting Financial Trends
NTC Industries Ltd, a micro-cap player in the FMCG sector, has delivered an outstanding financial performance in the quarter ended March 2026, prompting a significant upgrade in its financial trend rating from very positive to outstanding. The company’s latest quarterly results reveal robust revenue growth, margin expansion, and improved operational efficiency, marking a notable turnaround from previous quarters.
Read full news article
NTC Industries Ltd is Rated Hold by MarketsMOJO
NTC Industries Ltd is rated 'Hold' by MarketsMOJO, with this rating last updated on 31 May 2025. However, the analysis and financial metrics discussed here reflect the company’s current position as of 29 May 2026, providing investors with an up-to-date view of the stock’s fundamentals, valuation, financial trends, and technical outlook.
Read full news article Announcements
Closure of Trading Window
03-Jun-2026 | Source : BSEClosure of trading window
Announcement under Regulation 30 (LODR)-Newspaper Publication
29-May-2026 | Source : BSENewspaper Adv_AFR_March 2026
Compliances-Reg.24(A)-Annual Secretarial Compliance
27-May-2026 | Source : BSEAnnual Secretarial Compliance Report for the period ended on 31.03.2026
Corporate Actions

No Upcoming Board Meetings

NTC Industries Ltd has declared 5% dividend, ex-date: 10 Sep 09

No Splits history available

No Bonus history available

No Rights history available
Quality key factors
Valuation key factors
Technicals key factors
 Technical Indicator Scale: Bearish, Mildly Bearish, Sideways, Mildly Bullish, Bullish Turned
 Shareholding Snapshot : Mar 2026
Shareholding Compare (%holding)
Promoters
None
Held by 0 Schemes
Held by 4 FIIs (5.47%)
Sheetal Dugar (13.32%)
Sukhraj Babulalji Nahar (4.13%)
30.55%
Quarterly Results Snapshot (Consolidated) - Mar'26 - YoY

YoY Growth in quarter ended Mar 2026 is 33.69% vs 87.15% in Mar 2025
YoY Growth in quarter ended Mar 2026 is 3.07% vs 312.26% in Mar 2025
Half Yearly Results Snapshot (Consolidated) - Sep'25

Growth in half year ended Sep 2025 is 135.88% vs 4.02% in Sep 2024
Growth in half year ended Sep 2025 is 188.22% vs -45.71% in Sep 2024
Nine Monthly Results Snapshot (Consolidated) - Dec'25
YoY Growth in nine months ended Dec 2025 is 122.29% vs 23.62% in Dec 2024
YoY Growth in nine months ended Dec 2025 is 137.97% vs -24.12% in Dec 2024
Annual Results Snapshot (Consolidated) - Mar'26
YoY Growth in year ended Mar 2026 is 87.45% vs 42.63% in Mar 2025
YoY Growth in year ended Mar 2026 is 72.03% vs 124.70% in Mar 2025
About NTC Industries Ltd

Company Coordinates


