Odyssey Corpn.

  • Market Cap: Micro Cap
  • Industry: Non Banking Financial Company (NBFC)
  • ISIN: INE839E01023
  • NSEID: ODYCORP
  • BSEID: 531996
INR
6.89
-0.51 (-6.89%)
BSENSE

Sep 01, 03:30 PM

BSE+NSE Vol: 12.56 k

  • Price Points
  • Score
  • Mojo Parameters
  • Total Return
  • News and Corporate Actions
  • Key factors
  • Shareholding
  • Financials
  • CompanyCV
stock-summaryPrice Point
High/Low

1Day

52 Week

Valuation
Technical
Day's Volume

CASH

12.56 k (-4.96%) Volume

Shareholding (Jun 2026)

FII

0.00%

Held by 0 FIIs

DII

0.00%

Held by 0 DIIs

Promoter

48.24%

Why is Odyssey Corporation Ltd falling/rising?

02-Sep-2026

As of 01-Sep, Odyssey Corporation Ltd's stock price is at 6.89, reflecting a 6.89% decline. The stock has underperformed its sector and shows a year-to-date drop of 10.64%, indicating ongoing challenges despite a recent increase in delivery volume.

As of 01-Sep, Odyssey Corporation Ltd's stock price is falling, currently at 6.89, which reflects a decrease of 0.51 or 6.89%. This decline is part of a broader trend, as the stock has underperformed its sector by 5.57% today and has experienced consecutive falls over the last two days, totaling a drop of 8.51% in that period. <BR><BR>In terms of performance over different time frames, the stock has shown a year-to-date decline of 10.64% and a significant drop of 28.53% over the past year, indicating ongoing challenges. Although there was a positive return of 11.85% over the past month, the recent downturn suggests that this momentum has not been sustained. <BR><BR>Additionally, while the stock's delivery volume has increased by 46.98% against the 5-day average, indicating rising investor participation, it has not translated into price stability or growth. The stock is currently trading higher than its 20-day and 50-day moving averages but lower than its 5-day, 100-day, and 200-day moving averages, which may reflect a bearish sentiment among investors. Overall, these factors contribute to the current decline in Odyssey Corporation Ltd's stock price.

View full answer

Who are in the management team of Odyssey Corpn.?

01-Sep-2026

The management team of Odyssey Corpn. includes Hiten Mehta (Whole Time Director), Jai Prakash Jindal and Sameer Relia (Non Executive Independent Directors), Meeta H Mehta (Non Executive Director), and Preeti Yadav (Company Secretary and Compliance Officer).

The management team of Odyssey Corpn. includes the following individuals:<BR><BR>1. **Hiten Mehta** - Whole Time Director<BR>2. **Jai Prakash Jindal** - Non Executive Independent Director<BR>3. **Sameer Relia** - Non Executive Independent Director<BR>4. **Meeta H Mehta** - Non Executive Director<BR>5. **Preeti Yadav** - Company Secretary and Compliance Officer<BR><BR>If you need more details about any specific member or their roles, feel free to ask!

View full answer

What does Odyssey Corpn. do?

01-Sep-2026

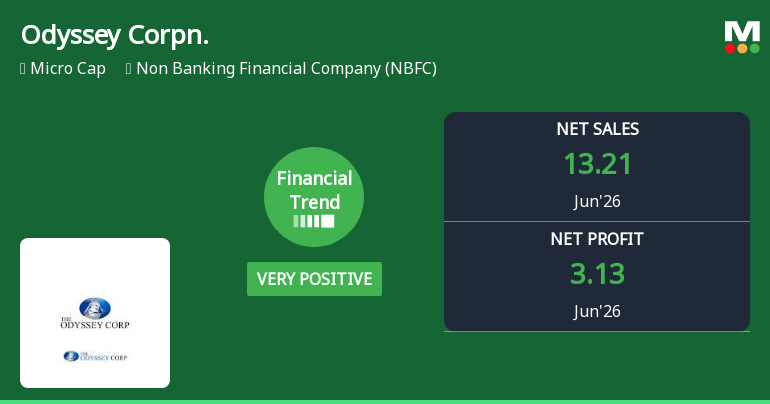
Odyssey Corporation Ltd is a Micro Cap NBFC focused on corporate finance, advisory services, and trading in shares and investments. As of June 2026, it reported net sales of 13 Cr and a net profit of 3 Cr, with a market cap of INR 69 Cr.

Overview: <BR>Odyssey Corporation Ltd is a Micro Cap company operating in the Non Banking Financial Company (NBFC) sector, primarily engaged in corporate finance, advisory services, and trading in shares and investments.<BR><BR>History: <BR>Odyssey Corporation Ltd was established in February 1995 and got listed on The Mumbai Stock Exchange. The latest quarterly results reported are for June 2026, showing net sales and profit figures.<BR><BR>Financial Snapshot: <BR>Most recent Net Sales: 13 Cr (Quarterly Results - Jun 2026) <BR>Most recent Net Profit: 3 Cr (Quarterly Results - Jun 2026) <BR>Market-cap value: INR 69 Cr (Micro Cap)<BR><BR>Key Metrics: <BR>P/E: 10.00 <BR>Industry P/E: 21 <BR>Dividend Yield: 0.00% <BR>Debt-Equity: 0.04 <BR>Return on Equity: 2.40% <BR>Price to Book: 0.38 <BR><BR>Contact Details: <BR>Address: 102 Haridarshan Building, Bhogilal Phadia Road Kandivali Mumbai Maharashtra : 400067 <BR>Email: odysseycl9999@gmail.com <BR>Website: http://www.odysseycorp.in

View full answer

Who are the peers of the Odyssey Corpn.?

01-Sep-2026

Odyssey Corpn.'s peers include Oasis Securities, Minolta Finance, Transwar.Fin., HB Portfolio, Banas Finance, BAMPSL Sec., Cont. Securities, Everlon Fin., Mantra Capital, and Dar Credit & Cap. Minolta Finance leads in 1-year returns at 18.64%, while Odyssey Corpn. has a return of -23.08%.

Peers: The peers of Odyssey Corpn. are Oasis Securities, Minolta Finance, Transwar.Fin., HB Portfolio, Banas Finance, BAMPSL Sec., Cont. Securities, Everlon Fin., Mantra Capital, and Dar Credit & Cap.<BR><BR>Quality Snapshot: Excellent management risk is observed at Oasis Securities, Minolta Finance, Transwar.Fin., Odyssey Corpn., HB Portfolio, Banas Finance, BAMPSL Sec., Cont. Securities, Mantra Capital, and Dar Credit & Cap, while Average management risk is found at Banas Finance and Everlon Fin. Below Average management risk is noted at Oasis Securities, Minolta Finance, Transwar.Fin., Odyssey Corpn., HB Portfolio, BAMPSL Sec., Cont. Securities, Mantra Capital, and Dar Credit & Cap. Growth is Excellent at Minolta Finance, Cont. Securities, and the rest, while Average growth is found at Banas Finance, Mantra Capital, and the rest, and Below Average growth is observed at Oasis Securities, Transwar.Fin., Odyssey Corpn., HB Portfolio, and the rest.<BR><BR>Return Snapshot: The peer with the highest 1-year return is Minolta Finance at 18.64%, while the peer with the lowest is Transwar.Fin. at -27.17%. Odyssey Corpn.'s 1-year return of -23.08% is better than Transwar.Fin. but worse than Minolta Finance. Additionally, the six-month return is negative for Transwar.Fin., HB Portfolio, and Everlon Fin.

View full answer

How big is Odyssey Corpn.?

01-Sep-2026

As of 31st August, Odyssey Corporation Ltd has a market capitalization of 69.00 Cr, with recent net sales of 54.75 Cr and a net profit of 6.85 Cr. Shareholder's funds are 169.03 Cr and total assets amount to 189.16 Cr as of March 2025.

As of 31st August, Odyssey Corporation Ltd has a market capitalization of 69.00 Cr, categorizing it as a Micro Cap company.<BR><BR>In the latest four quarters, Odyssey Corporation Ltd reported Net Sales of 54.75 Cr and a Net Profit of 6.85 Cr.<BR><BR>The latest annual period for the balance sheet is March 2025, with Shareholder's Funds amounting to 169.03 Cr and Total Assets of 189.16 Cr.

View full answer

Should I buy, sell or hold Odyssey Corporation Ltd?

12-Aug-2026

When is the next results date for Odyssey Corporation Ltd?

06-Aug-2026

The next results date for Odyssey Corporation Ltd is August 10, 2026.

The next results date for Odyssey Corporation Ltd is scheduled for August 10, 2026.

View full answer

Are Odyssey Corporation Ltd latest results good or bad?

28-May-2026

Odyssey Corporation Ltd's latest results are concerning, showing a consolidated net profit of ₹2.54 crores largely due to non-operating income, while the company faced an operating loss of ₹3.85 crores and a negative operating profit margin of -17.94%. Despite a significant increase in net sales, the reliance on non-operating income raises doubts about the sustainability of its earnings.

Odyssey Corporation Ltd's latest results present a concerning picture overall. While the company reported a consolidated net profit of ₹2.54 crores for Q4 FY26, this figure is heavily influenced by non-operating income, which accounted for a staggering 177.66% of profit before tax. The operational performance, however, is troubling, with an operating loss of ₹3.85 crores, marking the worst quarterly performance on record and resulting in a negative operating profit margin of -17.94%.<BR><BR>Despite a significant increase in net sales, which surged 171.99% quarter-on-quarter to ₹21.46 crores, this volatility highlights inconsistent revenue generation rather than sustainable growth. The company's average return on equity stands at a mere 2.55%, indicating weak capital efficiency, and its reliance on other income raises serious questions about the quality and sustainability of its earnings.<BR><BR>In summary, while there are some positive headline figures, the underlying operational challenges and reliance on non-operating income suggest that the results are more bad than good, pointing to significant structural issues within the company.

View full answer

Is Odyssey Corpn. overvalued or undervalued?

18-Nov-2025

As of November 17, 2025, Odyssey Corpn. is overvalued with a PE ratio of 73.49 and negative EV to EBITDA, underperforming the market with a 78.88% decline year-to-date, indicating significant operational inefficiencies and poor shareholder value delivery.

As of 17 November 2025, Odyssey Corpn. has moved from a fair valuation to a very expensive rating. The company is currently overvalued, with a PE ratio of 73.49, an EV to EBITDA ratio of -23.19, and a ROE of only 0.48%. In comparison, Bajaj Finance, another player in the NBFC sector, has a PE ratio of 34.85, while Life Insurance boasts a much lower PE of 11.33, highlighting the significant premium Odyssey Corpn. commands despite its poor performance metrics.<BR><BR>The company's financial ratios indicate substantial overvaluation, particularly given its negative EV to EBIT and EV to EBITDA figures, which suggest operational inefficiencies. Furthermore, Odyssey Corpn.'s stock has significantly underperformed relative to the Sensex, with a year-to-date decline of 78.88% compared to the Sensex's gain of 8.72%. This stark contrast reinforces the conclusion that Odyssey Corpn. is not only overvalued but also struggling to deliver shareholder value in the current market environment.

View full answer

How has been the historical performance of Odyssey Corpn.?

15-Nov-2025

Odyssey Corpn. has experienced significant fluctuations, with net sales declining from INR 100.25 crore in March 2022 to INR 28.34 crore in March 2025, while total assets increased from INR 69.36 crore to INR 189.16 crore. Despite a negative operating profit in March 2025, profit after tax improved slightly, and shareholder's funds rose to INR 169.03 crore.

Answer:<BR>The historical performance of Odyssey Corpn. shows significant fluctuations in key financial metrics over the years.<BR><BR>Breakdown:<BR>Odyssey Corpn. experienced a decline in net sales from INR 100.25 crore in March 2022 to INR 28.34 crore in March 2025, reflecting a downward trend in total operating income as well. The total expenditure, excluding depreciation, also decreased from INR 98.40 crore in March 2022 to INR 32.17 crore in March 2025. Operating profit (PBDIT) turned negative in March 2025 at INR -3.83 crore, following a positive operating profit of INR 6.28 crore in March 2022. Profit before tax showed a similar pattern, decreasing from INR 6.03 crore in March 2022 to INR 4.83 crore in March 2025. However, profit after tax improved slightly from INR 1.44 crore in March 2023 to INR 3.99 crore in March 2025. The company's total assets increased significantly from INR 69.36 crore in March 2022 to INR 189.16 crore in March 2025, driven by a rise in non-current investments. Shareholder's funds also rose to INR 169.03 crore in March 2025 from INR 69.15 crore in March 2022, indicating a strengthening equity position. Cash flow from operating activities turned negative in March 2025 at INR -31.00 crore, while cash flow from financing activities saw a substantial inflow of INR 62.00 crore, resulting in a net cash inflow of INR 11.00 crore for the year.

View full answer

Who are the top shareholders of the Odyssey Corpn.?

17-Jul-2025

The top shareholders of Odyssey Corpn. include Pooja Hemanshu Mehta with 19.81% and Gali Lakshmi Aruna with 2.3%. Individual investors collectively hold 49.4%, with no institutional holdings reported.

The top shareholders of Odyssey Corpn. include Pooja Hemanshu Mehta, who holds the highest promoter stake at 19.81%. The highest public shareholder is Gali Lakshmi Aruna, with a holding of 2.3%. Additionally, individual investors collectively hold 49.4% of the company's shares. There are no institutional holdings from mutual funds or foreign institutional investors.

View full answer

What is the technical trend for Odyssey Corpn.?

09-Jun-2025

As of May 8, 2025, Odyssey Corp. is in a bearish trend with moderate strength, indicated by a bearish MACD, daily moving averages, and weekly KST, while Bollinger Bands and Dow Theory also suggest continued weakness.

As of 8 May 2025, the technical trend for Odyssey Corpn. has changed from mildly bearish to bearish. The current stance is bearish with a moderate strength. Key indicators driving this include a bearish MACD on the weekly chart and a bearish signal from the daily moving averages. The weekly KST is also bearish, further supporting the negative outlook. The Bollinger Bands and Dow Theory both indicate a mildly bearish trend on the weekly and monthly time frames, suggesting continued weakness in price action.

View full answer

Has Odyssey Corpn. declared dividend?

06-Jun-2025

Odyssey Corporation Ltd has declared a 5% dividend, amounting to $0.50 per share, with an ex-date of September 22, 2011. However, the dividend yield is 0%, and while there has been significant price appreciation over the years, there has been no ongoing dividend income.

Odyssey Corporation Ltd has declared a 5% dividend.<BR><BR>Dividend Details:<BR>- Percentage announced: 5%<BR>- Amount per share: 0.5<BR>- Ex-date: 22 Sep 11<BR><BR>Dividend Yield: 0%<BR><BR>Total Returns by Period:<BR>In the 6-month period, the price return was -67.77%, the dividend return was 0%, resulting in a total return of -67.77%.<BR><BR>In the 1-year period, the price return was 57.7%, the dividend return was 0%, resulting in a total return of 57.7%.<BR><BR>In the 2-year period, the price return was 107.97%, the dividend return was 0%, resulting in a total return of 107.97%.<BR><BR>In the 3-year period, the price return was 127.91%, the dividend return was 0%, resulting in a total return of 127.91%.<BR><BR>In the 4-year period, the price return was 775.66%, the dividend return was 0%, resulting in a total return of 775.66%.<BR><BR>In the 5-year period, the price return was 1723.29%, the dividend return was 0%, resulting in a total return of 1723.29%.<BR><BR>Overall, while Odyssey Corporation Ltd has declared a dividend, the dividend yield remains at 0%. The total returns over various periods indicate significant price appreciation, especially over longer durations, despite the lack of ongoing dividend income.

View full answer
iScoreScore
Click here to find our call on this stock
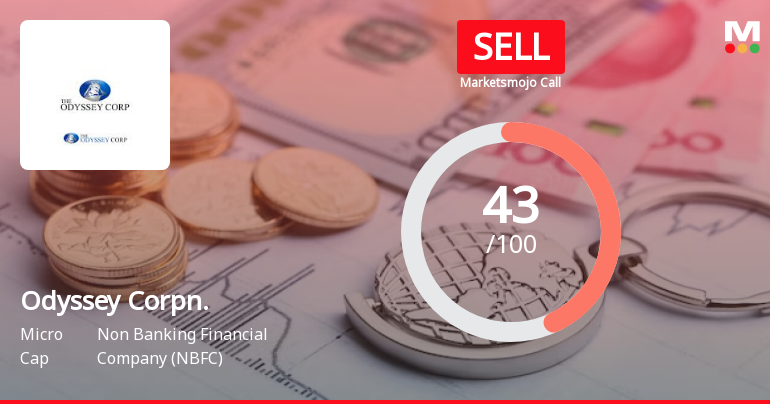
Strong Sell
Sell
Hold
Buy
Strong Buy

Dashboard

1

Weak Long Term Fundamental Strength with an average Return on Equity (ROE) of 2.00%

  • Poor long term growth as Net Sales has grown by an annual rate of 5.61%
2

Below par performance in long term as well as near term

stock-summaryMojo Parameters

Mojo Parameters

Loading Valuation Snapshot...

Stock DNA

stock-summary
Industry

Non Banking Financial Company (NBFC)

stock-summary
Market cap

INR 66 Cr (Micro Cap)

stock-summary
P/E

9.00

stock-summary
Industry P/E

21

stock-summary
Dividend Yield

0.00%

stock-summary
Debt Equity

0.04

stock-summary
Return on Equity

2.40%

stock-summary
Price to Book

0.37

Revenue and Profits:
Net Sales:
13 Cr
(Quarterly Results - Jun 2026)
Net Profit:
3 Cr
stock-summaryTotal Returns
Total Returns (Price + Dividend) stock-summary
Dividend Yield (0%)
TimePeriod
Price Return
Dividend Return
Total Return
3 Months
-4.57%
0%
-4.57%
6 Months
-15.15%
0%
-15.15%
1 Year
-28.53%
0%
-28.53%
2 Years
-54.67%
0%
-54.67%
3 Years
-6.13%
0%
-6.13%
4 Years
-31.24%
0%
-31.24%
5 Years
73.12%
0%
73.12%

Latest dividend: 0.25 per share ex-dividend date: Sep-22-2011

Risk Adjusted Returns v/s stock-summary
Returns Beta
Icon
Beta has not been calculated since enough price history is not available
stock-summaryNews & Corporate Actions

Announcements stock-summary

Announcement under Regulation 30 (LODR)-Newspaper Publication

11-Aug-2026 | Source : BSE

Newspaper Publication - Unaudited Financial Results (Standalone & Consolidated) for the quarter ended June 30 2026.

Submission Of Unaudited Financial Results For The Quarter Ended June 30 2026.

10-Aug-2026 | Source : BSE

Submission of unaudited financial results for the quarter ended June 30 2026.

Statement Of Deviation Or Variation In The Use Of Proceeds From

10-Aug-2026 | Source : BSE

Corporate Actions stock-summary

stock-summary
BOARD MEETING

No Upcoming Board Meetings

stock-summary
DIVIDEND

Odyssey Corporation Ltd has declared 5% dividend, ex-date: 22 Sep 11

stock-summary
SPLITS

Odyssey Corporation Ltd has announced 5:10 stock split, ex-date: 23 Dec 11

stock-summary
BONUS

No Bonus history available

stock-summary
RIGHTS

No Rights history available

stock-summaryKey Factors

Quality key factors stock-summary

Factor
Value
Sales Growth (5y)
5.61%
EBIT Growth (5y)
10.72%
Net Debt to Equity (avg)
0.04
Institutional Holding
0
ROE (avg)
2.00%

Valuation key factors

Factor
Value
P/E Ratio
9
Industry P/E
21
Price to Book Value
0.34
EV to EBIT
-6.91
EV to EBITDA
-7.64
EV to Capital Employed
0.27
EV to Sales
0.81
PEG Ratio
0.05
Dividend Yield
NA
ROCE (Latest)
-4.09%
ROE (Latest)
2.40%

Technicals key factors

Indicator
Weekly
Monthly
MACD
Mildly Bullish
Bearish
RSI
No Signal
No Signal
Bollinger Bands
Bearish
Bearish
Moving Averages
Mildly Bearish (Daily)
KST
Bearish
Bearish
Dow Theory
Mildly Bullish
No Trend
OBV
No Trend
No Trend
stock-summary Technical Indicator Scale: Bearish, Mildly Bearish, Sideways, Mildly Bullish, Bullish  Turned 
stock-summaryShareholding
Shareholding Snapshot : Jun 2026stock-summary
Shareholding Compare (%holding) stock-summary
Majority shareholders

Non Institution

Pledged Promoter Holdings

None

Mutual Funds

Held by 0 Schemes

FIIs

Held by 0 FIIs

Promoter with highest holding

Alacrity Securities Ltd (16.87%)

Highest Public shareholder

Nilarya Trading And Developers Private Limited (1.72%)

Individual Investors Holdings

39.25%

stock-summaryFinancial
[
  {
    "link": "quarterly",
    "btn_text": "All Quarterly Results",
    "header": "Quarterly Results Snapshot (Consolidated) - Jun'26 - YoY",
    "rhs": [
      {
        "prefix": "Net Sales ",
        "suffix": "YoY Growth in quarter ended Jun 2026 is 68.49% vs 639.62% in Jun 2025",
        "dir": -1
      },
      {
        "prefix": "Consolidated Net Profit ",
        "suffix": "YoY Growth in quarter ended Jun 2026 is 449.12% vs 200.00% in Jun 2025",
        "dir": 1
      }
    ],
    "table": {
      "header": [
        "Jun'26",
        "Jun'25",
        "Change(%)"
      ],
      "body": [
        {
          "field": "Net Sales",
          "val1": "13.21",
          "val2": "7.84",
          "chgp": "68.49%",
          "chgp_class": "positive"
        },
        {
          "field": "Operating Profit (PBDIT) excl Other Income",
          "val1": "0.91",
          "val2": "0.71",
          "chgp": "28.17%",
          "chgp_class": "positive"
        },
        {
          "field": "Interest",
          "val1": "0.09",
          "val2": "0.00",
          "chgp": "",
          "chgp_class": "neutral"
        },
        {
          "field": "Exceptional Items",
          "val1": "0.00",
          "val2": "0.00",
          "chgp": "",
          "chgp_class": "neutral"
        },
        {
          "field": "Consolidate Net Profit",
          "val1": "3.13",
          "val2": "0.57",
          "chgp": "449.12%",
          "chgp_class": "positive"
        },
        {
          "field": "Operating Profit Margin (Excl OI)",
          "val1": "6.89%",
          "val2": "9.06%",
          "chgp": "-2.17%",
          "chgp_class": "negative"
        }
      ]
    }
  },
  {
    "link": "half-yearly",
    "btn_text": "All Half Yearly Results",
    "header": "Half Yearly Results Snapshot (Consolidated) - Sep'25",
    "rhs": [
      {
        "prefix": "Net Sales ",
        "suffix": " Growth in half year ended Sep 2025 is 1,394.78% vs -92.88% in Sep 2024",
        "dir": 1
      },
      {
        "prefix": "Consolidated Net Profit ",
        "suffix": " Growth in half year ended Sep 2025 is -48.98% vs 3.70% in Sep 2024",
        "dir": -1
      }
    ],
    "table": {
      "header": [
        "Sep'25",
        "Sep'24",
        "Change(%)"
      ],
      "body": [
        {
          "field": "Net Sales",
          "val1": "20.03",
          "val2": "1.34",
          "chgp": "1,394.78%",
          "chgp_class": "positive"
        },
        {
          "field": "Operating Profit (PBDIT) excl Other Income",
          "val1": "0.29",
          "val2": "-0.49",
          "chgp": "159.18%",
          "chgp_class": "positive"
        },
        {
          "field": "Interest",
          "val1": "0.00",
          "val2": "0.03",
          "chgp": "-100.00%",
          "chgp_class": "positive"
        },
        {
          "field": "Exceptional Items",
          "val1": "0.00",
          "val2": "0.00",
          "chgp": "",
          "chgp_class": "neutral"
        },
        {
          "field": "Consolidate Net Profit",
          "val1": "1.00",
          "val2": "1.96",
          "chgp": "-48.98%",
          "chgp_class": "negative"
        },
        {
          "field": "Operating Profit Margin (Excl OI)",
          "val1": "1.45%",
          "val2": "-36.57%",
          "chgp": "38.02%",
          "chgp_class": "positive"
        }
      ]
    }
  },
  {
    "link": "nine-monthly",
    "btn_text": "All Nine Monthly Results",
    "header": "Nine Monthly Results Snapshot (Consolidated) - Dec'25",
    "rhs": [
      {
        "prefix": "Net Sales ",
        "suffix": "YoY Growth in nine months ended Dec 2025 is 83.56% vs -37.43% in Dec 2024",
        "dir": 1
      },
      {
        "prefix": "Consolidated Net Profit ",
        "suffix": "YoY Growth in nine months ended Dec 2025 is -15.87% vs -2.35% in Dec 2024",
        "dir": -1
      }
    ],
    "table": {
      "header": [
        "Dec'25",
        "Dec'24",
        "Change(%)"
      ],
      "body": [
        {
          "field": "Net Sales",
          "val1": "27.92",
          "val2": "15.21",
          "chgp": "83.56%",
          "chgp_class": "positive"
        },
        {
          "field": "Operating Profit (PBDIT) excl Other Income",
          "val1": "-2.13",
          "val2": "-0.95",
          "chgp": "-124.21%",
          "chgp_class": "negative"
        },
        {
          "field": "Interest",
          "val1": "0.00",
          "val2": "0.36",
          "chgp": "-100.00%",
          "chgp_class": "positive"
        },
        {
          "field": "Exceptional Items",
          "val1": "0.00",
          "val2": "0.00",
          "chgp": "",
          "chgp_class": "neutral"
        },
        {
          "field": "Consolidate Net Profit",
          "val1": "1.75",
          "val2": "2.08",
          "chgp": "-15.87%",
          "chgp_class": "negative"
        },
        {
          "field": "Operating Profit Margin (Excl OI)",
          "val1": "-7.63%",
          "val2": "-6.25%",
          "chgp": "-1.38%",
          "chgp_class": "negative"
        }
      ]
    }
  },
  {
    "link": "annual",
    "btn_text": "All Annual Results",
    "header": "Annual Results Snapshot (Consolidated) - Mar'26",
    "rhs": [
      {
        "prefix": "Net Sales ",
        "suffix": "YoY Growth in year ended Mar 2026 is 74.24% vs -13.09% in Mar 2025",
        "dir": 1
      },
      {
        "prefix": "Consolidated Net Profit ",
        "suffix": "YoY Growth in year ended Mar 2026 is 229.17% vs -11.66% in Mar 2025",
        "dir": 1
      }
    ],
    "table": {
      "header": [
        "Mar'26",
        "Mar'25",
        "Change(%)"
      ],
      "body": [
        {
          "field": "Net Sales",
          "val1": "49.38",
          "val2": "28.34",
          "chgp": "74.24%",
          "chgp_class": "positive"
        },
        {
          "field": "Operating Profit (PBDIT) excl Other Income",
          "val1": "-5.97",
          "val2": "-3.83",
          "chgp": "-55.87%",
          "chgp_class": "negative"
        },
        {
          "field": "Interest",
          "val1": "0.38",
          "val2": "0.14",
          "chgp": "171.43%",
          "chgp_class": "negative"
        },
        {
          "field": "Exceptional Items",
          "val1": "0.00",
          "val2": "0.00",
          "chgp": "",
          "chgp_class": "neutral"
        },
        {
          "field": "Consolidate Net Profit",
          "val1": "4.74",
          "val2": "1.44",
          "chgp": "229.17%",
          "chgp_class": "positive"
        },
        {
          "field": "Operating Profit Margin (Excl OI)",
          "val1": "-12.09%",
          "val2": "-13.51%",
          "chgp": "1.42%",
          "chgp_class": "positive"
        }
      ]
    }
  }
]

Quarterly Results Snapshot (Consolidated) - Jun'26 - YoYstock-summary

Jun'26
Jun'25
Change(%)
Net Sales
13.21
7.84
68.49%
Operating Profit (PBDIT) excl Other Income
0.91
0.71
28.17%
Interest
0.09
0.00
Exceptional Items
0.00
0.00
Consolidate Net Profit
3.13
0.57
449.12%
Operating Profit Margin (Excl OI)
6.89%
9.06%
-2.17%
Values in Rs Cr.
Direction Arrows
Net Sales

YoY Growth in quarter ended Jun 2026 is 68.49% vs 639.62% in Jun 2025

Direction Arrows
Consolidated Net Profit

YoY Growth in quarter ended Jun 2026 is 449.12% vs 200.00% in Jun 2025

Half Yearly Results Snapshot (Consolidated) - Sep'25stock-summary

Sep'25
Sep'24
Change(%)
Net Sales
20.03
1.34
1,394.78%
Operating Profit (PBDIT) excl Other Income
0.29
-0.49
159.18%
Interest
0.00
0.03
-100.00%
Exceptional Items
0.00
0.00
Consolidate Net Profit
1.00
1.96
-48.98%
Operating Profit Margin (Excl OI)
1.45%
-36.57%
38.02%
Values in Rs Cr.
Direction Arrows
Net Sales

Growth in half year ended Sep 2025 is 1,394.78% vs -92.88% in Sep 2024

Direction Arrows
Consolidated Net Profit

Growth in half year ended Sep 2025 is -48.98% vs 3.70% in Sep 2024

Nine Monthly Results Snapshot (Consolidated) - Dec'25stock-summary

Dec'25
Dec'24
Change(%)
Net Sales
27.92
15.21
83.56%
Operating Profit (PBDIT) excl Other Income
-2.13
-0.95
-124.21%
Interest
0.00
0.36
-100.00%
Exceptional Items
0.00
0.00
Consolidate Net Profit
1.75
2.08
-15.87%
Operating Profit Margin (Excl OI)
-7.63%
-6.25%
-1.38%
Values in Rs Cr.
Direction Arrows
Net Sales

YoY Growth in nine months ended Dec 2025 is 83.56% vs -37.43% in Dec 2024

Direction Arrows
Consolidated Net Profit

YoY Growth in nine months ended Dec 2025 is -15.87% vs -2.35% in Dec 2024

Annual Results Snapshot (Consolidated) - Mar'26stock-summary

Mar'26
Mar'25
Change(%)
Net Sales
49.38
28.34
74.24%
Operating Profit (PBDIT) excl Other Income
-5.97
-3.83
-55.87%
Interest
0.38
0.14
171.43%
Exceptional Items
0.00
0.00
Consolidate Net Profit
4.74
1.44
229.17%
Operating Profit Margin (Excl OI)
-12.09%
-13.51%
1.42%
Values in Rs Cr.
Direction Arrows
Net Sales

YoY Growth in year ended Mar 2026 is 74.24% vs -13.09% in Mar 2025

Direction Arrows
Consolidated Net Profit

YoY Growth in year ended Mar 2026 is 229.17% vs -11.66% in Mar 2025

stock-summaryCompany CV
About Odyssey Corporation Ltd stock-summary
stock-summary
Odyssey Corporation Ltd
Micro Cap
Non Banking Financial Company (NBFC)
Odyssey Corporation Ltd, established in February, 1995 got listed on The Mumbai Stock Exchange. Initially, the Company was engaged in corporate finance, advisory services and trading in shares and investments, etc.
Company Coordinates stock-summary
Company Details
102 Haridarshan Building, Bhogilal Phadia Road Kandivali Mumbai Maharashtra : 400067
stock-summary
Tel:
stock-summary
odysseycl9999@gmail.com
Registrar Details
Bigshare Services Pvt Ltd , E-2 , Ansa Industrial Estate, Saki Vihar Road, Saki Naka, Andheri (E), Mumbai