
Compare Omnitech Engg. with Similar Stocks
Stock DNA
Heavy Electrical Equipment
INR 6,999 Cr (Mid Cap)
73.00
44
0.00%
0.39
11.29%
10.31
Total Returns (Price + Dividend) 
Omnitech Engg. for the last several years.
Risk Adjusted Returns v/s
Returns Beta

News

Omnitech Engineering Ltd Faces Mildly Bearish Technical Shift Amid Mixed Momentum
Omnitech Engineering Ltd, a mid-cap player in the Heavy Electrical Equipment sector, has experienced a subtle shift in its technical momentum, moving from a sideways trend to a mildly bearish stance. Despite a modest day gain of 0.21% to close at ₹549.20, recent technical indicators suggest caution for investors as momentum indicators and trend assessments reflect emerging weaknesses.
Read full news article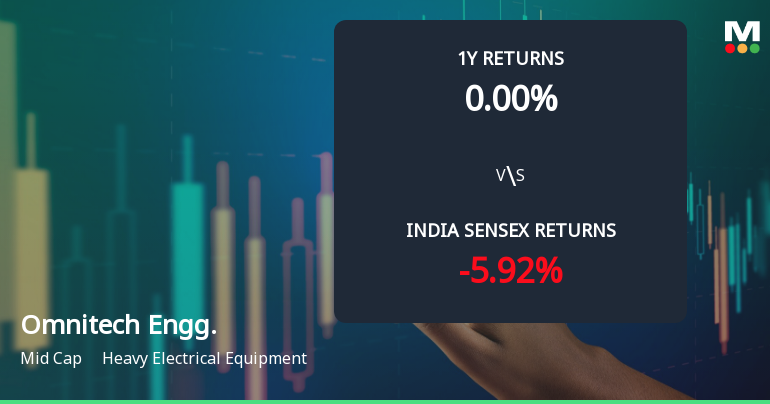
Omnitech Engineering Ltd Sees Technical Momentum Shift Amid Mixed Market Signals
Omnitech Engineering Ltd, a mid-cap player in the Heavy Electrical Equipment sector, has experienced a notable shift in its technical momentum, moving from a mildly bullish stance to a sideways trend. Despite a robust day change of 4.20%, the company’s technical indicators present a complex picture, prompting a downgrade in its Mojo Grade from Hold to Sell as of 6 July 2026.
Read full news article
Omnitech Engineering Ltd is Rated Sell
Omnitech Engineering Ltd is rated Sell by MarketsMOJO. This rating was last updated on 06 July 2026, reflecting a reassessment of the stock’s outlook. However, all fundamentals, returns, and financial metrics discussed below are current as of 12 July 2026, providing investors with the latest perspective on the company’s position.
Read full news article Announcements
Compliances-Certificate under Reg. 74 (5) of SEBI (DP) Regulations 2018
08-Jul-2026 | Source : BSECertificate under Regulation 74(5) of SEBI (Depositories Participants) Regulations 2018 for the quarter ended June 30 2026
Closure of Trading Window
26-Jun-2026 | Source : BSEThe Trading Window for dealing in the Securities of Omnitech Engineering Limited (the Company) shall remain closed for the Directors Promoters Promoter Group Designated Persons and their immediate relatives from Wednesday July 01 2026 until the expiry of 48 hours after the declaration of unaudited Financials Results (Standalone and Consolidated) of the Company for the quarter ended June 30 2026.
Announcement under Regulation 30 (LODR)-Earnings Call Transcript
29-May-2026 | Source : BSESubmission of transcript of the conference call held with Analysts/investors on Wednesday May 27 2026 subsequent to declaration of the Audited Financial Results of the Company for the quarter and financial year ended March 31 2026
Corporate Actions

No Upcoming Board Meetings

No Dividend history available

No Splits history available

No Bonus history available

No Rights history available
Quality key factors
Valuation key factors
Technicals key factors
 Technical Indicator Scale: Bearish, Mildly Bearish, Sideways, Mildly Bullish, Bullish Turned
 Shareholding Snapshot : Jun 2026
Shareholding Compare (%holding)
Promoters
None
Held by 5 Schemes (10.19%)
Held by 19 FIIs (4.31%)
Udaykumar Arunkumar Parekh (73.3%)
Nippon Life India Trustee Ltd-a/c Nippon India Small Cap Fund (7.29%)
9.7%
Quarterly Results Snapshot (Standalone) - Mar'26 - QoQ

QoQ Growth in quarter ended Mar 2026 is 0.88% vs 8.23% in Dec 2025

QoQ Growth in quarter ended Mar 2026 is 13.06% vs 0.92% in Dec 2025
Annual Results Snapshot (Standalone) - Mar'26
YoY Growth in year ended Mar 2026 is 48.39% vs 83.61% in Mar 2025
YoY Growth in year ended Mar 2026 is 77.10% vs 81.70% in Mar 2025
About Omnitech Engineering Ltd

Company Coordinates


