
Compare One Mobikwik with Similar Stocks
Stock DNA
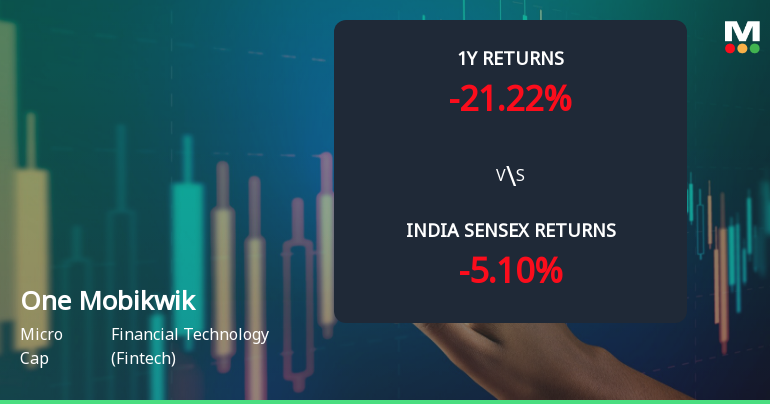
Financial Technology (Fintech)
INR 1,579 Cr (Micro Cap)
NA (Loss Making)
21
0.00%
0.51
-8.65%
2.95
Total Returns (Price + Dividend) 
One Mobikwik for the last several years.
Risk Adjusted Returns v/s
Returns Beta

News
One Mobikwik Systems Ltd Faces Technical Momentum Shift Amid Bearish Signals
One Mobikwik Systems Ltd, a micro-cap player in the Financial Technology sector, has experienced a notable shift in its technical momentum, signalling increased bearish pressures despite some mildly bullish weekly indicators. The stock’s recent price action and technical parameters suggest a cautious outlook for investors amid a broader market context that has seen the company underperform the Sensex over multiple time horizons.
Read full news articleWhen is the next results date for One Mobikwik Systems Ltd?
The next results date for One Mobikwik Systems Ltd is scheduled for August 3, 2026....
Read full news article
One Mobikwik Systems Ltd is Rated Strong Sell
One Mobikwik Systems Ltd is rated Strong Sell by MarketsMOJO, with this rating last updated on 20 July 2026. However, the analysis and financial metrics discussed here reflect the stock's current position as of 26 July 2026, providing investors with the latest insights into its performance and outlook.
Read full news article Announcements
Announcement under Regulation 30 (LODR)-Analyst / Investor Meet - Intimation
27-Jul-2026 | Source : BSEIntimation of the Earnings Call
Board Meeting Intimation for Consider And Approve The Unaudited Financial Results (Standalone And Consolidated) Of The Company For The Quarter Ended June 30 2026 (Financial Results).
27-Jul-2026 | Source : BSEOne Mobikwik Systems Ltdhas informed BSE that the meeting of the Board of Directors of the Company is scheduled on 03/08/2026 inter alia to consider and approve the unaudited financial results (standalone and consolidated) of the Company for the quarter ended June 30 2026 (Financial Results).
Announcement under Regulation 30 (LODR)-Acquisition
21-Jul-2026 | Source : BSEInvestment in the wholly owned subsidiaries of the Company
Corporate Actions

03 Aug 2026

No Dividend history available

No Splits history available

No Bonus history available

No Rights history available
Quality key factors
Valuation key factors
Technicals key factors
 Technical Indicator Scale: Bearish, Mildly Bearish, Sideways, Mildly Bullish, Bullish Turned
 Shareholding Snapshot : Jun 2026
Shareholding Compare (%holding)
Non Institution
None
Held by 1 Schemes (0.06%)
Held by 10 FIIs (4.48%)
Bipin Preet Singh (14.52%)
Bajaj Finance Limited (10.13%)
41.59%
Quarterly Results Snapshot (Consolidated) - Mar'26 - QoQ

QoQ Growth in quarter ended Mar 2026 is -0.08% vs 6.94% in Dec 2025
QoQ Growth in quarter ended Mar 2026 is 8.15% vs 114.15% in Dec 2025
Half Yearly Results Snapshot (Consolidated) - Sep'25
Growth in half year ended Sep 2025 is -14.43% vs 66.08% in Sep 2024
Growth in half year ended Sep 2025 is -590.89% vs -207.70% in Sep 2024
Nine Monthly Results Snapshot (Consolidated) - Dec'25
YoY Growth in nine months ended Dec 2025 is -7.96% vs 47.93% in Dec 2024

YoY Growth in nine months ended Dec 2025 is -1.53% vs -544.00% in Dec 2024
Annual Results Snapshot (Consolidated) - Mar'26
YoY Growth in year ended Mar 2026 is -4.35% vs 33.73% in Mar 2025
YoY Growth in year ended Mar 2026 is 48.90% vs -963.14% in Mar 2025
About One Mobikwik Systems Ltd

Company Coordinates


