
Compare Onelife Capital with Similar Stocks
Dashboard
With a Operating Losses, the company has a Weak Long Term Fundamental Strength
The company has declared positive results in Mar'2026 after 2 consecutive negative quarters
With ROE of 7.4, it has a Attractive valuation with a 1.9 Price to Book Value
71% of Promoter Shares are Pledged
Market Beating performance in long term as well as near term
Total Returns (Price + Dividend) 
Onelife Capital for the last several years.
Risk Adjusted Returns v/s
Returns Beta

News

Onelife Capital Advisors Ltd is Rated Hold by MarketsMOJO
Onelife Capital Advisors Ltd is rated Hold by MarketsMOJO, with this rating last updated on 01 June 2026. However, the analysis and financial metrics discussed here reflect the company’s current position as of 19 July 2026, providing investors with the latest insights into its performance and outlook.
Read full news article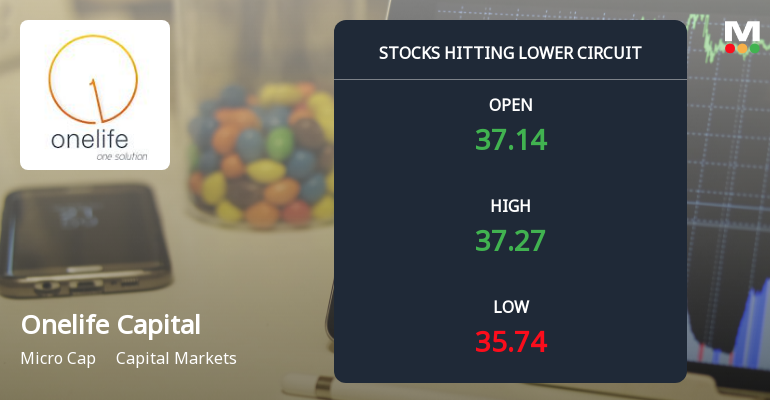
Onelife Capital Advisors Ltd Locks at Lower Circuit With 3.49% Loss — Sellers Queue, No Buyers in Sight
At Rs 36.00, Onelife Capital Advisors Ltd locked at its lower circuit on 07 Jul 2026, falling 3.49% within a 5% price band. Sellers were lined up at the floor price, but buyers were absent, resulting in unfilled supply and a frozen trading price for the session.
Read full news article
Onelife Capital Advisors Ltd is Rated Hold
Onelife Capital Advisors Ltd is rated 'Hold' by MarketsMOJO, with this rating last updated on 01 June 2026. However, the analysis and financial metrics discussed here reflect the company’s current position as of 08 July 2026, providing investors with an up-to-date view of its fundamentals, returns, and market performance.
Read full news article Announcements
Compliances-Certificate under Reg. 74 (5) of SEBI (DP) Regulations 2018
14-Jul-2026 | Source : BSEEnclosed herewith Certificate under reg 74(5) of SEBI (DP) Reg 2018 for quarter ended June30 2026
Shareholder Meeting / Postal Ballot-Outcome of Postal_Ballot
13-Jul-2026 | Source : BSEOutcome of Postal ballot for approval of RPT Transaction and ESOP approval
Shareholder Meeting / Postal Ballot-Scrutinizers Report
13-Jul-2026 | Source : BSEEnclosed herewith Scrutinizer report of Postal ballot passed on 10.07.2026
Corporate Actions

No Upcoming Board Meetings

No Dividend history available

No Splits history available

No Bonus history available

Onelife Capital Advisors Ltd has announced 300:167 rights issue, ex-date: 16 Feb 26
Quality key factors
Valuation key factors
Technicals key factors
 Technical Indicator Scale: Bearish, Mildly Bearish, Sideways, Mildly Bullish, Bullish Turned
 Shareholding Snapshot : Mar 2026
Shareholding Compare (%holding)
Non Institution
70.9992
Held by 0 Schemes
Held by 0 FIIs
Naig Prabhakar K (25.62%)
Uday Zaveri (6.33%)
68.04%
Quarterly Results Snapshot (Consolidated) - Mar'26 - QoQ

QoQ Growth in quarter ended Mar 2026 is 664.71% vs -86.79% in Dec 2025
QoQ Growth in quarter ended Mar 2026 is 811.18% vs 62.39% in Dec 2025
Half Yearly Results Snapshot (Consolidated) - Sep'25

Growth in half year ended Sep 2025 is -45.99% vs 179.49% in Sep 2024
Growth in half year ended Sep 2025 is 18.34% vs -833.33% in Sep 2024
Nine Monthly Results Snapshot (Consolidated) - Dec'25
YoY Growth in nine months ended Dec 2025 is -48.06% vs 118.95% in Dec 2024
YoY Growth in nine months ended Dec 2025 is 24.21% vs -665.52% in Dec 2024
Annual Results Snapshot (Consolidated) - Mar'26
YoY Growth in year ended Mar 2026 is -19.24% vs -69.51% in Mar 2025
YoY Growth in year ended Mar 2026 is 204.28% vs -1,417.95% in Mar 2025
About Onelife Capital Advisors Ltd

Company Coordinates


