Oracle Fin.Serv.

  • Market Cap: Mid Cap
  • Industry: Software Products
  • ISIN: INE881D01027
  • NSEID: OFSS
  • BSEID: 532466
INR
11,751.00
371 (3.26%)
BSENSE

Aug 14, 04:01 PM

BSE+NSE Vol: 2.72 lacs

  • Price Points
  • Score
  • Mojo Parameters
  • Total Return
  • News and Corporate Actions
  • Key factors
  • Shareholding
  • Financials
  • CompanyCV
stock-summaryPrice Point
High/Low

1Day

52 Week

Valuation
Technical
Day's Volume

CASH

2.72 lacs (31.71%) Volume

Shareholding (Jun 2026)

FII

9.70%

Held by 686 FIIs

DII

8.79%

Held by 24 DIIs

Promoter

72.41%

Why is Oracle Financial Services Software Ltd falling/rising?

15-Aug-2026

As of 15-Aug, Oracle Financial Services Software Ltd's stock price is rising to 11,751.00, reflecting a 3.26% increase. This rise is driven by strong fundamentals, including a high Return on Equity, impressive profit growth, and increased institutional investor confidence, while the stock is nearing its 52-week high.

As of 15-Aug, Oracle Financial Services Software Ltd's stock price is rising, currently at 11,751.00, reflecting an increase of 371.0 or 3.26%. This upward movement can be attributed to several factors. The stock has shown a trend reversal, gaining after two consecutive days of decline, and it has outperformed its sector by 3.58% today. Additionally, the stock is close to its 52-week high, just 2.01% away from Rs 11,986.9, and it reached an intraday high of Rs 11,849.95, which is a 4.13% increase.<BR><BR>The company has demonstrated strong long-term fundamental strength, evidenced by an impressive average Return on Equity (ROE) of 28.25% and being net-debt free. Furthermore, Oracle Financial Services reported outstanding results with a 73.3% growth in operating profit and significant increases in net sales and profit after tax in the last quarter. The participation of institutional investors has also increased, with their stake rising by 1.32%, indicating confidence in the company's fundamentals.<BR><BR>Moreover, the stock has consistently outperformed the broader market, generating a 36.85% return over the past year while the Sensex has declined by 3.21%. This strong performance, coupled with a high dividend yield of 3.51%, enhances its attractiveness to investors. Overall, these positive indicators contribute to the rising stock price of Oracle Financial Services Software Ltd.

View full answer

Who are in the management team of Oracle Fin.Serv.?

14-Aug-2026

The management team of Oracle Fin.Serv. includes Chaitanya Kamat (Managing Director & CEO), S Venkatachalam (Chairman), and several directors such as Richard David Jackson, Harinderjit Singh, and Jane Murphy, among others, who collectively guide the company's strategy and operations.

The management team of Oracle Fin.Serv. includes the following individuals:<BR><BR>1. **Chaitanya Kamat** - Managing Director & CEO<BR>2. **S Venkatachalam** - Chairman & Independent Director<BR>3. **Richard David Jackson** - Independent Director<BR>4. **Harinderjit Singh** - Director<BR>5. **Onkarnath Banerjee** - Company Secretary & Compliance Officer<BR>6. **Sridhar Srinivasan** - Independent Director<BR>7. **Kimberly Woolley** - Director<BR>8. **Yong Meng Kau** - Director<BR>9. **Vincent Secondo Grelli** - Director<BR>10. **Jane Murphy** - Independent Director<BR>11. **Makarand Padalkar** - Managing Director & CEO<BR>12. **Gopala Ramanan Balasubramanian** - Director<BR>13. **Mrugank Paranjape** - Additional Director<BR><BR>This team plays a crucial role in guiding the company's strategy and operations.

View full answer

What does Oracle Fin.Serv. do?

14-Aug-2026

Oracle Financial Services Software Ltd specializes in software products for the financial services industry, reporting net sales of 3,125 Cr and a net profit of 1,416 Cr for June 2026, with a market cap of INR 101,312 Cr. The company has a P/E ratio of 29.00 and a dividend yield of 3.43%.

Overview:<BR>Oracle Financial Services Software Ltd operates in the software products industry and is classified as a mid-cap company.<BR><BR>History:<BR>The company was incorporated on September 27, 1989, originally as 'Citicorp Information Technology Industries Limited'. It underwent a name change to 'I-flex solutions Limited' on February 11, 2000, and later rebranded to 'Oracle Financial Services Software Limited' on August 14, 2008. The latest quarterly results reported net sales and net profit for June 2026.<BR><BR>Financial Snapshot:<BR>Net Sales: 3,125 Cr (Quarterly Results - Jun 2026) <BR>Net Profit: 1,416 Cr (Quarterly Results - Jun 2026) <BR>Market Cap: INR 101,312 Cr (Mid Cap)<BR><BR>Key Metrics:<BR>P/E: 29.00 <BR>Industry P/E: 22 <BR>Dividend Yield: 3.43% <BR>Debt Equity: -0.70 <BR>Return on Equity: 33.72% <BR>Price to Book: 12.96 <BR><BR>Contact Details:<BR>Address: Oracle Park Goregaon (East), Off Western Express Highway Mumbai Maharashtra : 400063 <BR>Tel: 91-22-67183000 <BR>Email: investors-vp-ofss_in@oracle.com <BR>Website: https://investor.ofss.oracle.com

View full answer

Who are the peers of the Oracle Fin.Serv.?

14-Aug-2026

Oracle Fin.Serv.'s peers include Tanla Platforms, C.E. Info System, Moschip Tech., Technvision Ven., Ramco Systems, Blue Cloud Soft., Nucleus Soft., Unicommerce, and Quick Heal Tech. Key metrics show Oracle Fin.Serv. has excellent management and capital structure, with a 1-year return of 32.74%, while Ramco Systems leads with 47.47%.

Peers: The peers of Oracle Fin.Serv. are Tanla Platforms, C.E. Info System, Moschip Tech., Technvision Ven., Ramco Systems, Blue Cloud Soft., Nucleus Soft., Unicommerce, and Quick Heal Tech.<BR><BR>Quality Snapshot: Excellent management risk is observed at Oracle Fin.Serv., while Good management risk is found at Nucleus Soft. and Unicommerce, and the rest have Average or Below Average management risk. Average growth is noted at Oracle Fin.Serv. and Blue Cloud Soft., while Excellent growth is seen at Moschip Tech., Unicommerce, and the rest have Below Average growth. Excellent capital structure is present at Oracle Fin.Serv., Tanla Platforms, C.E. Info System, Technvision Ven., Nucleus Soft., and Unicommerce, while the rest have Average or Below Average capital structure.<BR><BR>Return Snapshot: The peer with the highest 1-year return is Ramco Systems at 47.47%, while C.E. Info System has the lowest at -44.01%. Oracle Fin.Serv.'s 1-year return of 32.74% is significantly higher than C.E. Info System's but lower than Ramco Systems'. Additionally, the six-month return is negative for C.E. Info System, Ramco Systems, Blue Cloud Soft., Nucleus Soft., Unicommerce, and Quick Heal Tech.

View full answer

How big is Oracle Fin.Serv.?

14-Aug-2026

As of 14th August, Oracle Financial Services Software Ltd has a market capitalization of 102,749.10 Cr, with recent net sales of 8,945.10 Cr and net profit of 3,412.90 Cr over the last four quarters.

As of 14th August, <BR><BR>Market Cap: Oracle Financial Services Software Ltd has a market capitalization of 102,749.10 Cr, classified as a Mid Cap.<BR><BR>Recent Quarterly Performance: The sum of Net Sales for the latest 4 quarters is 8,945.10 Cr, while the sum of Net Profit for the same period is 3,412.90 Cr.<BR><BR>Balance Sheet Snapshot: The reporting period for the latest annual data is March 2026. Shareholder's Funds stand at 7,826.50 Cr, and Total Assets amount to 9,735.80 Cr.

View full answer

Are Oracle Financial Services Software Ltd latest results good or bad?

23-Jul-2026

Oracle Financial Services Software Ltd's latest Q1 FY27 results are very strong, with a net profit of ₹1,415.50 crore (up 120.52% year-on-year) and revenue of ₹3,125.20 crore (up 68.73%). The company boasts a record operating margin of 60.04% and a return on equity of 33.72%, indicating robust demand and a positive outlook.

Oracle Financial Services Software Ltd's latest results for Q1 FY27 are exceptionally strong. The company reported a net profit of ₹1,415.50 crore, reflecting a remarkable year-on-year growth of 120.52%. Revenue also surged, reaching ₹3,125.20 crore, which is a 68.73% increase compared to the same quarter last year. <BR><BR>The operating margin has reached a record high of 60.04%, showcasing the company's operational efficiency. Additionally, the return on equity (ROE) stands at an impressive 33.72%, indicating exceptional profitability on shareholder capital. <BR><BR>Overall, the results indicate robust demand for Oracle's products and strong operational leverage, positioning the company favorably within the financial services software sector. The solid financial performance, combined with a debt-free balance sheet and strong cash generation, suggests a positive outlook for the company.

View full answer

Should I buy, sell or hold Oracle Financial Services Software Ltd?

23-Jul-2026

When is the next results date for Oracle Financial Services Software Ltd?

15-Jul-2026

The next results date for Oracle Financial Services Software Ltd is July 22, 2026.

The next results date for Oracle Financial Services Software Ltd is scheduled for July 22, 2026.

View full answer

Has Oracle Financial Services Software Ltd declared dividend?

24-Apr-2026

Yes, Oracle Financial Services Software Ltd has declared a dividend of 5400% (₹130 per share) with an ex-date of May 7, 2026. The company has shown strong total returns across various periods, particularly over the long term.

Oracle Financial Services Software Ltd has declared a dividend.<BR><BR>Dividend Details:<BR>- Percentage announced: 5400%<BR>- Amount per share: 130<BR>- Ex-date: 07 May 26<BR><BR>Dividend Yield: 4.49%<BR><BR>Total Returns by Period:<BR>In the last 3 months, the price return was 12.55%, the dividend return was 3.37%, resulting in a total return of 15.92%.<BR><BR>Over the last 6 months, the price return was 4.59%, the dividend return was 4.60%, leading to a total return of 9.19%.<BR><BR>For the 1-year period, the price return was 2.24%, the dividend return was 7.52%, culminating in a total return of 9.76%.<BR><BR>In the 2-year span, the price return was 21.72%, the dividend return was 11.52%, which resulted in a total return of 33.24%.<BR><BR>Over the last 3 years, the price return was 162.18%, the dividend return was 25.91%, giving a total return of 188.09%.<BR><BR>In the 4-year period, the price return was 156.77%, the dividend return was 35.86%, resulting in a total return of 192.63%.<BR><BR>For the 5-year duration, the price return was 174.43%, the dividend return was 36.45%, leading to a total return of 210.88%.<BR><BR>Overall, Oracle Financial Services Software Ltd has declared a significant dividend, and the total returns across various periods indicate strong performance, particularly in the longer term, with substantial growth in both price and dividends.

View full answer

Is Oracle Fin.Serv. technically bullish or bearish?

04-Dec-2025

As of December 3, 2025, the stock trend has shifted to mildly bearish, with a current price of 8060.00 below the previous close of 8103.80, reflecting a significant underperformance of -35.70% over the past year compared to the Sensex's 5.27%.

As of 3 December 2025, the technical trend has changed from sideways to mildly bearish. The current price of 8060.00 is below the previous close of 8103.80, indicating downward pressure. The stock has underperformed significantly over the past year, with a return of -35.70% compared to the Sensex's 5.27%. Additionally, the recent weekly performance shows a decline of -1.44%, further supporting a bearish stance. Key indicators driving this view include the negative trend change and substantial underperformance relative to the broader market.

View full answer

How has been the historical performance of Oracle Fin.Serv.?

03-Nov-2025

Oracle Fin.Serv. has shown consistent growth, with net sales increasing from 4,861.28 Cr in March 2020 to 6,846.80 Cr in March 2025, alongside improvements in operating profit, profit before tax, and earnings per share. Despite negative cash flow from investing activities, the company maintains a strong balance sheet with rising total assets and shareholder funds.

Answer:<BR>The historical performance of Oracle Fin.Serv. shows a consistent growth trend in net sales and profits over the years, culminating in a net sales figure of 6,846.80 Cr for the year ending March 2025. This marks an increase from 6,373.00 Cr in March 2024 and 5,698.31 Cr in March 2023. The total operating income mirrored this growth, reaching 6,846.80 Cr in March 2025, up from 6,373.00 Cr in the previous year. Operating profit (PBDIT) also saw an upward trajectory, rising to 3,380.50 Cr in March 2025 from 3,124.70 Cr in March 2024. Profit before tax increased to 3,310.90 Cr in March 2025, compared to 3,022.30 Cr in March 2024, while profit after tax reached 2,379.60 Cr, up from 2,219.40 Cr. The earnings per share (EPS) improved to 274.15 in March 2025 from 256.28 in March 2024, reflecting the company's strong profitability. <BR><BR>In terms of balance sheet metrics, total assets grew to 9,952.30 Cr in March 2025 from 9,749.40 Cr in March 2024, with total liabilities also increasing to 9,952.30 Cr from 9,749.40 Cr. Shareholder's funds rose to 8,362.40 Cr in March 2025, indicating a solid equity base. The cash flow from operating activities improved to 2,198.00 Cr in March 2025 from 1,790.00 Cr in March 2024, although cash flow from investing activities turned negative at -2,371.00 Cr. Overall, the company demonstrated robust growth in revenue and profitability, alongside a stable balance sheet, despite fluctuations in cash flow from investing activities.<BR><BR>Breakdown:<BR>Oracle Fin.Serv. has shown a strong upward trend in its financial performance over the years, with net sales increasing from 4,861.28 Cr in March 2020 to 6,846.80 Cr in March 2025. The total operating income followed suit, reaching 6,846.80 Cr in March 2025, reflecting consistent growth. Operating profit (PBDIT) also rose significantly, from 2,228.69 Cr in March 2020 to 3,380.50 Cr in March 2025, indicating improved operational efficiency. Profit before tax increased from 2,252.28 Cr in March 2020 to 3,310.90 Cr in March 2025, while profit after tax saw a substantial rise from 1,462.22 Cr to 2,379.60 Cr over the same period. The earnings per share (EPS) improved from 170.26 in March 2020 to 274.15 in March 2025, showcasing enhanced shareholder value. On the balance sheet, total assets grew from 7,919.98 Cr in March 2020 to 9,952.30 Cr in March 2025, with total liabilities rising in tandem. Shareholder's funds also increased, reflecting a solid equity position. Cash flow from operating activities improved significantly, although cash flow from investing activities turned negative in March 2025, indicating increased investment outflows. Overall, Oracle Fin.Serv. has demonstrated robust growth in key financial metrics, underpinned by strong operational performance.

View full answer

Who are the top shareholders of the Oracle Fin.Serv.?

17-Jul-2025

The top shareholders of Oracle Fin.Serv. include Oracle Global Mauritius Limited with 72.59%, followed by foreign institutional investors at 8.75%, mutual funds at 5.61%, and individual investors at 7.54%. The highest public shareholder is Kotak Mahindra Trustee Co Ltd, holding 2.98%.

The top shareholders of Oracle Fin.Serv. include a significant majority held by promoters, with Oracle Global Mauritius Limited being the largest shareholder at 72.59%. Additionally, mutual funds hold 5.61% through 28 schemes, while foreign institutional investors (FIIs) account for 8.75% with 619 FIIs involved. The highest public shareholder is Kotak Mahindra Trustee Co Ltd, which holds 2.98%. Individual investors collectively own 7.54% of the company.

View full answer

Is Oracle Fin.Serv. overvalued or undervalued?

09-Jun-2025

As of January 18, 2024, Oracle Fin.Serv. is considered very expensive and overvalued with a PE ratio of 32.13, significantly higher than its peers TCS and Infosys, despite strong ROCE and ROE metrics, and its recent stock performance shows a decline of 28.29% year-to-date.

As of 18 January 2024, the valuation grade for Oracle Fin.Serv. has moved from expensive to very expensive, indicating a significant shift in its market perception. The company is currently deemed overvalued based on its high valuation multiples, including a PE ratio of 32.13, an EV to EBITDA ratio of 22.93, and a PEG ratio of 4.63. These figures suggest that investors are paying a premium for the stock relative to its earnings growth potential.<BR><BR>In comparison to its peers, Oracle Fin.Serv. stands out with a much higher PE ratio than TCS at 25.23 and Infosys at 24.32, both of which are considered attractive and fair, respectively. Additionally, while Oracle boasts a strong ROCE of 122.41% and ROE of 28.46%, these metrics do not sufficiently justify its elevated valuation levels. The company's recent stock performance has outpaced the Sensex in the short term, with a 1-week return of 8.83% compared to the Sensex's 1.40%, but its year-to-date performance shows a decline of 28.29%, further reinforcing the notion that it is overvalued in the current market environment.

View full answer
iScoreScore
Part of MojoOne Strategy
Click here to find our call on this stock
Strong Sell
Sell
Hold
Buy
Strong Buy

Dashboard

1

Strong Long Term Fundamental Strength with an average Return on Equity (ROE) of 28.25%

  • The company is Net-Debt Free
2

With a growth in Operating Profit of 73.3%, the company declared Outstanding results in Jun 26

3

Increasing Participation by Institutional Investors

4

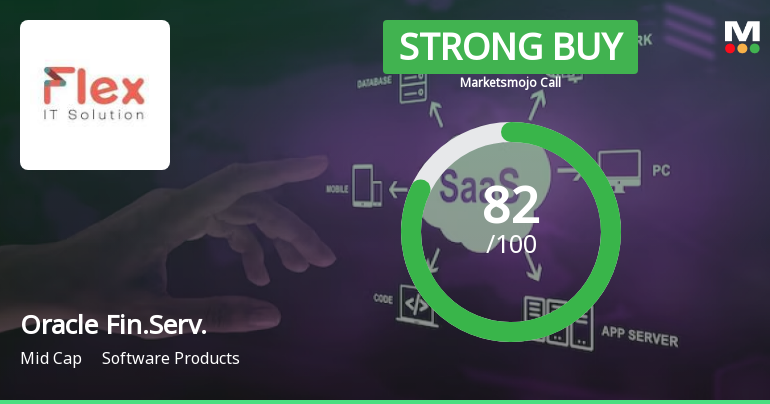
Company is among the highest 1% of companies rated by MarketsMojo across all 4,000 stocks

stock-summaryMojo Parameters

Mojo Parameters

Loading Valuation Snapshot...

Stock DNA

stock-summary
Industry

Software Products

stock-summary
Market cap

INR 98,639 Cr (Mid Cap)

stock-summary
P/E

30.00

stock-summary
Industry P/E

22

stock-summary
Dividend Yield

3.51%

stock-summary
Debt Equity

-0.70

stock-summary
Return on Equity

33.72%

stock-summary
Price to Book

12.66

Revenue and Profits:
Net Sales:
3,125 Cr
(Quarterly Results - Jun 2026)
Net Profit:
1,416 Cr
stock-summaryTotal Returns
Total Returns (Price + Dividend) stock-summary
Dividend Yield (3.51%)
TimePeriod
Price Return
Dividend Return
Total Return
3 Months
31.98%
0%
31.98%
6 Months
76.93%
3.94%
80.87%
1 Year
36.85%
4.60%
41.45%
2 Years
10.48%
6.04%
16.52%
3 Years
195.31%
21.90%
217.21%
4 Years
247.77%
36.52%
284.29%
5 Years
154.88%
27.16%
182.04%

Latest dividend: 270 per share ex-dividend date: May-07-2026

Risk Adjusted Returns v/s stock-summary
Returns Beta
Icon
Beta has not been calculated since enough price history is not available
stock-summaryNews & Corporate Actions

Announcements stock-summary

Intimation Of Grant Of Options Under OFSS Stock Plan 2014

10-Aug-2026 | Source : BSE

Please find enclosed the intimation for grant of options under OFSS Stock Plan 2014.

AGM Transcript

05-Aug-2026 | Source : BSE

Please find enclosed the transcript of the 37th Annual General Meeting held on Thursday July 23 2026 at 3:00 PM IST.

Shareholder Meeting / Postal Ballot-Scrutinizers Report

27-Jul-2026 | Source : BSE

Please find enclosed the voting results under Regulation 44(3) of the SEBI (Listing Obligations and Disclosure Requirements) Regulations 2015 along with the consolidated scrutinizers report for the AGM held on July 23 2026.

Corporate Actions stock-summary

stock-summary
BOARD MEETING

No Upcoming Board Meetings

stock-summary
DIVIDEND

Oracle Financial Services Software Ltd has declared 5400% dividend, ex-date: 07 May 26

stock-summary
SPLITS

No Splits history available

stock-summary
BONUS

No Bonus history available

stock-summary
RIGHTS

No Rights history available

stock-summaryKey Factors

Quality key factors stock-summary

Factor
Value
Sales Growth (5y)
12.14%
EBIT Growth (5y)
13.03%
EBIT to Interest (avg)
100.00
Debt to EBITDA (avg)
Net Debt is too low
Net Debt to Equity (avg)
-0.70
Sales to Capital Employed (avg)
0.84
Tax Ratio
27.59%
Dividend Payout Ratio
131.85%
Pledged Shares
0
Institutional Holding
18.49%
ROCE (avg)
121.95%
ROE (avg)
28.25%

Valuation key factors

Factor
Value
P/E Ratio
30
Industry P/E
22
Price to Book Value
13.07
EV to EBIT
21.79
EV to EBITDA
21.48
EV to Capital Employed
41.22
EV to Sales
10.83
PEG Ratio
0.72
Dividend Yield
3.40%
ROCE (Latest)
145.24%
ROE (Latest)
33.72%

Technicals key factors

Indicator
Weekly
Monthly
MACD
Bullish
Bullish
RSI
No Signal
No Signal
Bollinger Bands
Bullish
Bullish
Moving Averages
Bullish (Daily)
KST
Bullish
Bullish
Dow Theory
Mildly Bullish
No Trend
OBV
Mildly Bullish
No Trend
stock-summary Technical Indicator Scale: Bearish, Mildly Bearish, Sideways, Mildly Bullish, Bullish  Turned 
stock-summaryShareholding
Shareholding Snapshot : Jun 2026stock-summary
Shareholding Compare (%holding) stock-summary
Majority shareholders

Promoters

Pledged Promoter Holdings

None

Mutual Funds

Held by 33 Schemes (5.42%)

FIIs

Held by 686 FIIs (9.7%)

Promoter with highest holding

Oracle Global Mauritius Limited (72.41%)

Highest Public shareholder

Kotak Mahindra Trustee Co Ltd A/c Kotak Special Op (2.45%)

Individual Investors Holdings

6.72%

stock-summaryFinancial
[
  {
    "link": "quarterly",
    "btn_text": "All Quarterly Results",
    "header": "Quarterly Results Snapshot (Consolidated) - Jun'26 - QoQ",
    "rhs": [
      {
        "prefix": "Net Sales ",
        "suffix": "QoQ Growth in quarter ended Jun 2026 is 51.33% vs 5.05% in Mar 2026",
        "dir": 1
      },
      {
        "prefix": "Consolidated Net Profit ",
        "suffix": "QoQ Growth in quarter ended Jun 2026 is 68.17% vs 38.07% in Mar 2026",
        "dir": 1
      }
    ],
    "table": {
      "header": [
        "Jun'26",
        "Mar'26",
        "Change(%)"
      ],
      "body": [
        {
          "field": "Net Sales",
          "val1": "3,125.20",
          "val2": "2,065.20",
          "chgp": "51.33%",
          "chgp_class": "positive"
        },
        {
          "field": "Operating Profit (PBDIT) excl Other Income",
          "val1": "1,876.50",
          "val2": "1,056.30",
          "chgp": "77.65%",
          "chgp_class": "positive"
        },
        {
          "field": "Interest",
          "val1": "0.70",
          "val2": "-7.90",
          "chgp": "108.86%",
          "chgp_class": "negative"
        },
        {
          "field": "Exceptional Items",
          "val1": "0.00",
          "val2": "0.00",
          "chgp": "",
          "chgp_class": "neutral"
        },
        {
          "field": "Consolidate Net Profit",
          "val1": "1,415.50",
          "val2": "841.70",
          "chgp": "68.17%",
          "chgp_class": "positive"
        },
        {
          "field": "Operating Profit Margin (Excl OI)",
          "val1": "60.04%",
          "val2": "51.15%",
          "chgp": "8.89%",
          "chgp_class": "positive"
        }
      ]
    }
  },
  {
    "link": "half-yearly",
    "btn_text": "All Half Yearly Results",
    "header": "Half Yearly Results Snapshot (Consolidated) - Sep'25",
    "rhs": [
      {
        "prefix": "Net Sales ",
        "suffix": " Growth in half year ended Sep 2025 is 6.61% vs 17.49% in Sep 2024",
        "dir": -1
      },
      {
        "prefix": "Consolidated Net Profit ",
        "suffix": " Growth in half year ended Sep 2025 is -0.54% vs 30.05% in Sep 2024",
        "dir": -1
      }
    ],
    "table": {
      "header": [
        "Sep'25",
        "Sep'24",
        "Change(%)"
      ],
      "body": [
        {
          "field": "Net Sales",
          "val1": "3,641.00",
          "val2": "3,415.30",
          "chgp": "6.61%",
          "chgp_class": "positive"
        },
        {
          "field": "Operating Profit (PBDIT) excl Other Income",
          "val1": "1,601.50",
          "val2": "1,597.70",
          "chgp": "0.24%",
          "chgp_class": "positive"
        },
        {
          "field": "Interest",
          "val1": "3.50",
          "val2": "13.10",
          "chgp": "-73.28%",
          "chgp_class": "positive"
        },
        {
          "field": "Exceptional Items",
          "val1": "0.00",
          "val2": "0.00",
          "chgp": "",
          "chgp_class": "neutral"
        },
        {
          "field": "Consolidate Net Profit",
          "val1": "1,188.00",
          "val2": "1,194.40",
          "chgp": "-0.54%",
          "chgp_class": "negative"
        },
        {
          "field": "Operating Profit Margin (Excl OI)",
          "val1": "43.99%",
          "val2": "46.78%",
          "chgp": "-2.79%",
          "chgp_class": "negative"
        }
      ]
    }
  },
  {
    "link": "nine-monthly",
    "btn_text": "All Nine Monthly Results",
    "header": "Nine Monthly Results Snapshot (Consolidated) - Dec'25",
    "rhs": [
      {
        "prefix": "Net Sales ",
        "suffix": "YoY Growth in nine months ended Dec 2025 is 9.29% vs 8.46% in Dec 2024",
        "dir": 1
      },
      {
        "prefix": "Consolidated Net Profit ",
        "suffix": "YoY Growth in nine months ended Dec 2025 is 3.57% vs 4.61% in Dec 2024",
        "dir": -1
      }
    ],
    "table": {
      "header": [
        "Dec'25",
        "Dec'24",
        "Change(%)"
      ],
      "body": [
        {
          "field": "Net Sales",
          "val1": "5,606.90",
          "val2": "5,130.50",
          "chgp": "9.29%",
          "chgp_class": "positive"
        },
        {
          "field": "Operating Profit (PBDIT) excl Other Income",
          "val1": "2,421.10",
          "val2": "2,311.60",
          "chgp": "4.74%",
          "chgp_class": "positive"
        },
        {
          "field": "Interest",
          "val1": "10.40",
          "val2": "9.80",
          "chgp": "6.12%",
          "chgp_class": "negative"
        },
        {
          "field": "Exceptional Items",
          "val1": "0.00",
          "val2": "0.00",
          "chgp": "",
          "chgp_class": "neutral"
        },
        {
          "field": "Consolidate Net Profit",
          "val1": "1,797.60",
          "val2": "1,735.70",
          "chgp": "3.57%",
          "chgp_class": "positive"
        },
        {
          "field": "Operating Profit Margin (Excl OI)",
          "val1": "43.18%",
          "val2": "45.06%",
          "chgp": "-1.88%",
          "chgp_class": "negative"
        }
      ]
    }
  },
  {
    "link": "annual",
    "btn_text": "All Annual Results",
    "header": "Annual Results Snapshot (Consolidated) - Mar'26",
    "rhs": [
      {
        "prefix": "Net Sales ",
        "suffix": "YoY Growth in year ended Mar 2026 is 12.05% vs 7.43% in Mar 2025",
        "dir": 1
      },
      {
        "prefix": "Consolidated Net Profit ",
        "suffix": "YoY Growth in year ended Mar 2026 is 10.91% vs 7.22% in Mar 2025",
        "dir": 1
      }
    ],
    "table": {
      "header": [
        "Mar'26",
        "Mar'25",
        "Change(%)"
      ],
      "body": [
        {
          "field": "Net Sales",
          "val1": "7,672.10",
          "val2": "6,846.80",
          "chgp": "12.05%",
          "chgp_class": "positive"
        },
        {
          "field": "Operating Profit (PBDIT) excl Other Income",
          "val1": "3,477.40",
          "val2": "3,076.30",
          "chgp": "13.04%",
          "chgp_class": "positive"
        },
        {
          "field": "Interest",
          "val1": "2.50",
          "val2": "0.50",
          "chgp": "400.00%",
          "chgp_class": "negative"
        },
        {
          "field": "Exceptional Items",
          "val1": "0.00",
          "val2": "0.00",
          "chgp": "",
          "chgp_class": "neutral"
        },
        {
          "field": "Consolidate Net Profit",
          "val1": "2,639.30",
          "val2": "2,379.60",
          "chgp": "10.91%",
          "chgp_class": "positive"
        },
        {
          "field": "Operating Profit Margin (Excl OI)",
          "val1": "45.33%",
          "val2": "44.93%",
          "chgp": "0.40%",
          "chgp_class": "positive"
        }
      ]
    }
  }
]

Quarterly Results Snapshot (Consolidated) - Jun'26 - QoQstock-summary

Jun'26
Mar'26
Change(%)
Net Sales
3,125.20
2,065.20
51.33%
Operating Profit (PBDIT) excl Other Income
1,876.50
1,056.30
77.65%
Interest
0.70
-7.90
108.86%
Exceptional Items
0.00
0.00
Consolidate Net Profit
1,415.50
841.70
68.17%
Operating Profit Margin (Excl OI)
60.04%
51.15%
8.89%
Values in Rs Cr.
Direction Arrows
Net Sales

QoQ Growth in quarter ended Jun 2026 is 51.33% vs 5.05% in Mar 2026

Direction Arrows
Consolidated Net Profit

QoQ Growth in quarter ended Jun 2026 is 68.17% vs 38.07% in Mar 2026

Half Yearly Results Snapshot (Consolidated) - Sep'25stock-summary

Sep'25
Sep'24
Change(%)
Net Sales
3,641.00
3,415.30
6.61%
Operating Profit (PBDIT) excl Other Income
1,601.50
1,597.70
0.24%
Interest
3.50
13.10
-73.28%
Exceptional Items
0.00
0.00
Consolidate Net Profit
1,188.00
1,194.40
-0.54%
Operating Profit Margin (Excl OI)
43.99%
46.78%
-2.79%
Values in Rs Cr.
Direction Arrows
Net Sales

Growth in half year ended Sep 2025 is 6.61% vs 17.49% in Sep 2024

Direction Arrows
Consolidated Net Profit

Growth in half year ended Sep 2025 is -0.54% vs 30.05% in Sep 2024

Nine Monthly Results Snapshot (Consolidated) - Dec'25stock-summary

Dec'25
Dec'24
Change(%)
Net Sales
5,606.90
5,130.50
9.29%
Operating Profit (PBDIT) excl Other Income
2,421.10
2,311.60
4.74%
Interest
10.40
9.80
6.12%
Exceptional Items
0.00
0.00
Consolidate Net Profit
1,797.60
1,735.70
3.57%
Operating Profit Margin (Excl OI)
43.18%
45.06%
-1.88%
Values in Rs Cr.
Direction Arrows
Net Sales

YoY Growth in nine months ended Dec 2025 is 9.29% vs 8.46% in Dec 2024

Direction Arrows
Consolidated Net Profit

YoY Growth in nine months ended Dec 2025 is 3.57% vs 4.61% in Dec 2024

Annual Results Snapshot (Consolidated) - Mar'26stock-summary

Mar'26
Mar'25
Change(%)
Net Sales
7,672.10
6,846.80
12.05%
Operating Profit (PBDIT) excl Other Income
3,477.40
3,076.30
13.04%
Interest
2.50
0.50
400.00%
Exceptional Items
0.00
0.00
Consolidate Net Profit
2,639.30
2,379.60
10.91%
Operating Profit Margin (Excl OI)
45.33%
44.93%
0.40%
Values in Rs Cr.
Direction Arrows
Net Sales

YoY Growth in year ended Mar 2026 is 12.05% vs 7.43% in Mar 2025

Direction Arrows
Consolidated Net Profit

YoY Growth in year ended Mar 2026 is 10.91% vs 7.22% in Mar 2025

stock-summaryCompany CV
About Oracle Financial Services Software Ltd stock-summary
stock-summary
Oracle Financial Services Software Ltd
Mid Cap
Software Products
Oracle Financial Services Software Limited was erstwhile incorporated in September 27, 1989 as 'Citicorp Information Technology Industries Limited'. The Company changed its name from Citicorp Information Technology Industries Limited to 'I-flex solutions Limited' on 11 February, 2000 and thereafter, changed the name from I-flex solutions Limited to 'Oracle Financial Services Software Limited' on August 14, 2008.
Company Coordinates stock-summary
Company Details
Oracle Park Goregaon (East), Off Western Express Highway Mumbai Maharashtra : 400063
stock-summary
Tel: 91-22-67183000
stock-summary
investors-vp-ofss_in@oracle.com
Registrar Details
Link Intime India Pvt Ltd, C-13 Pannalal Silk Compound, L B S Marg, Bhandup , Mumbai