
Compare Orbit Exports with Similar Stocks
Dashboard
Company has a Debt to Equity ratio (avg) of 0.07 times
Healthy long term growth as Operating profit has grown by an annual rate 105.54%
With a fall in Net Sales of -12.56%, the company declared Very Negative results in Mar 26
With ROE of 10.6, it has a Fair valuation with a 1.7 Price to Book Value
Despite the size of the company, domestic mutual funds hold only 0% of the company
Stock DNA
Garments & Apparels
INR 509 Cr (Micro Cap)
15.00
23
0.00%
0.03
10.61%
1.68
Total Returns (Price + Dividend) 
Latest dividend: 3 per share ex-dividend date: Mar-16-2020
Risk Adjusted Returns v/s
Returns Beta

News

Orbit Exports Ltd Upgraded to Hold by MarketsMOJO Amid Mixed Financial and Technical Signals
Orbit Exports Ltd, a micro-cap player in the Garments & Apparels sector, has seen its investment rating upgraded from Sell to Hold as of 10 June 2026. This shift reflects improvements in technical indicators and valuation metrics, despite recent financial challenges. The company’s Mojo Score now stands at 51.0, signalling a cautious but more optimistic outlook for investors.
Read full news article
Orbit Exports Ltd Technical Momentum Shifts Amid Mixed Market Signals
Orbit Exports Ltd, a micro-cap player in the Garments & Apparels sector, has exhibited a notable shift in its technical momentum, moving from a sideways trend to a mildly bullish stance. Despite a sharp intraday price decline of 10.59% to close at ₹195.55 on 11 Jun 2026, the stock’s weekly and monthly technical indicators reveal a nuanced picture of emerging strength amid short-term volatility.
Read full news article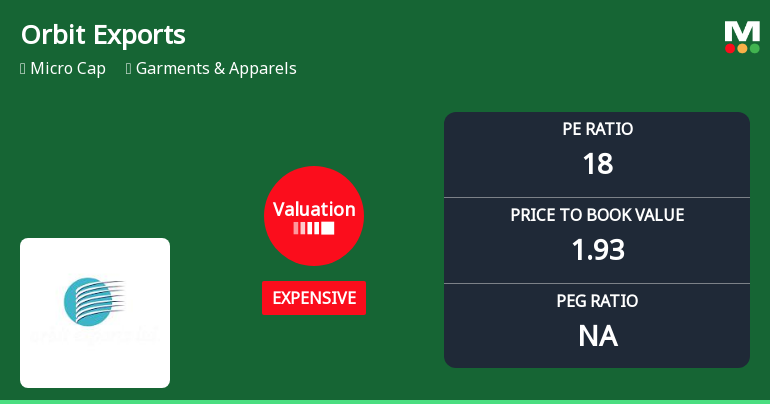
Orbit Exports Ltd Valuation Shift Signals Expensive Territory Amid Strong Price Gains
Orbit Exports Ltd, a micro-cap player in the Garments & Apparels sector, has witnessed a significant shift in its valuation parameters, moving from an attractive to an expensive rating. This change comes amid a robust price rally, with the stock surging over 17% in a single day and outperforming the broader Sensex across multiple time frames. However, despite the recent gains, the company’s valuation metrics now suggest a more cautious stance for investors.
Read full news article Announcements
Compliances-Reg.24(A)-Annual Secretarial Compliance
22-May-2026 | Source : BSEAs per enclosed file.
Announcement under Regulation 30 (LODR)-Newspaper Publication
11-May-2026 | Source : BSEAs per enclosed file.
Board Meeting Outcome for Outcome Of The Board Meeting Held On May 09 2026
09-May-2026 | Source : BSEAs per enclosed file
Corporate Actions

No Upcoming Board Meetings

Orbit Exports Ltd has declared 30% dividend, ex-date: 16 Mar 20

No Splits history available

Orbit Exports Ltd has announced 1:1 bonus issue, ex-date: 14 Feb 17

Orbit Exports Ltd has announced 1:1 rights issue, ex-date: 13 Sep 07
Quality key factors
Valuation key factors
Technicals key factors
 Technical Indicator Scale: Bearish, Mildly Bearish, Sideways, Mildly Bullish, Bullish Turned
 Shareholding Snapshot : Mar 2026
Shareholding Compare (%holding)
Promoters
None
Held by 0 Schemes
Held by 0 FIIs
Pankaj Seth (41.24%)
Sushila Paraskumar Daga (4.47%)
26.14%
Quarterly Results Snapshot (Consolidated) - Mar'26 - QoQ

QoQ Growth in quarter ended Mar 2026 is -12.56% vs -3.29% in Dec 2025
QoQ Growth in quarter ended Mar 2026 is -84.76% vs -34.73% in Dec 2025
Half Yearly Results Snapshot (Consolidated) - Sep'25

Growth in half year ended Sep 2025 is 10.87% vs 1.83% in Sep 2024
Growth in half year ended Sep 2025 is -2.87% vs 11.93% in Sep 2024
Nine Monthly Results Snapshot (Consolidated) - Dec'25
YoY Growth in nine months ended Dec 2025 is 8.78% vs 7.24% in Dec 2024
YoY Growth in nine months ended Dec 2025 is -2.41% vs 13.92% in Dec 2024
Annual Results Snapshot (Consolidated) - Mar'26
YoY Growth in year ended Mar 2026 is 6.06% vs 8.85% in Mar 2025
YoY Growth in year ended Mar 2026 is -16.41% vs 14.50% in Mar 2025
About Orbit Exports Ltd

Company Coordinates


