
Compare Orchid Pharma with Similar Stocks
Dashboard
Weak Long Term Fundamental Strength with an average Return on Equity (ROE) of 5.10%
- Poor long term growth as Net Sales has grown by an annual rate of 12.51% and Operating profit at 15.95% over the last 5 years
Flat results in Mar 26
With ROCE of 0.4, it has a Very Expensive valuation with a 3.3 Enterprise value to Capital Employed
Stock DNA
Pharmaceuticals & Biotechnology
INR 4,910 Cr (Small Cap)
181.00
34
0.00%
0.22
2.09%
3.61
Total Returns (Price + Dividend) 
Latest dividend: 3 per share ex-dividend date: Sep-13-2012
Risk Adjusted Returns v/s
Returns Beta

News
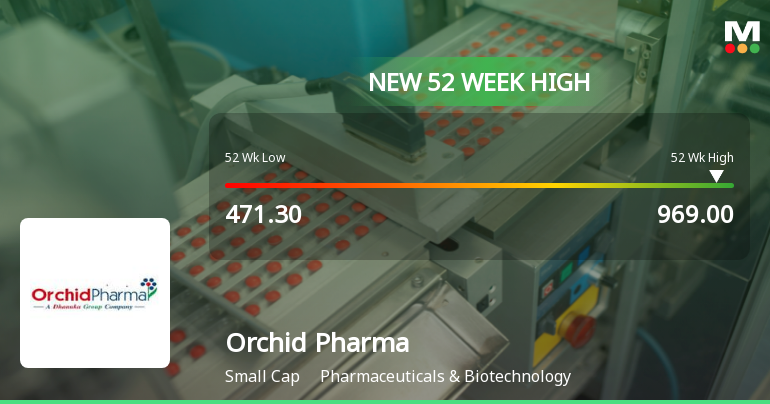
Broad-Based Technical Strength Lifts Orchid Pharma Ltd to 52-Week High of Rs 969
Surging past its previous peaks, Orchid Pharma Ltd touched a fresh 52-week high of Rs 969 on 15 Jun 2026, propelled by a confluence of bullish technical indicators and sustained price momentum that has captivated market attention.
Read full news article
Orchid Pharma Ltd Upgraded to Sell on Technical Improvement Despite Flat Financials
Orchid Pharma Ltd has seen its investment rating upgraded from Strong Sell to Sell as of 12 June 2026, driven primarily by a marked improvement in technical indicators despite persistent fundamental challenges. The pharmaceutical small-cap’s recent price surge and bullish technical signals contrast with its flat financial performance and valuation concerns, presenting a nuanced outlook for investors.
Read full news article
Orchid Pharma Ltd Shows Technical Momentum Shift Amid Strong Price Rally
Orchid Pharma Ltd has exhibited a notable shift in its technical momentum, moving from a mildly bearish to a mildly bullish trend, supported by a complex interplay of technical indicators. Despite a recent upgrade in its Mojo Grade from Strong Sell to Sell, the stock’s price action and momentum metrics reveal a nuanced outlook for investors in the Pharmaceuticals & Biotechnology sector.
Read full news article Announcements
Update Related To The Scheme Of Amalgamation Of Dhanuka Laboratories Limited And Orchid Pharma Limited
12-Jun-2026 | Source : BSEUpdate for receipt of copy of order related to scheme of Amalgamation of Dhanuka Laboratories limited and Orchid Pharma limited
Announcement under Regulation 30 (LODR)-Award_of_Order_Receipt_of_Order
11-Jun-2026 | Source : BSEDisclosure regarding the order passed by Goods and Service Department.
Update Related To The Scheme Of Amalgamation Of Dhanuka Laboratories Limited (Amalgamating Company) With Orchid Pharma Limited (Amalgamated Company) And Their Respective Shareholders And Creditors (The Scheme) Under Regulation 30 Of SEBI (Listing Obligati
05-Jun-2026 | Source : BSEIn continuation to our earlier intimation dated March 18 2026 with respect to merger petition we would like to inform that Honble National Company Law Tribunal (NCLT) on June 05 2026 i.e. today has allowed our petition sanctioning the scheme of Amalgamation and Arrangement of Dhanuka Laboratories Limited with Orchid Pharma Limited and their respective Shareholders and Creditors by virtue of which the Amalgamating Company would stand transferred to and vested in or deemed to have been transferred and vested in Amalgamated Company on a going concern basis.
Corporate Actions

No Upcoming Board Meetings

Orchid Pharma Ltd has declared 30% dividend, ex-date: 13 Sep 12

No Splits history available

No Bonus history available

No Rights history available
Quality key factors
Valuation key factors
Technicals key factors
 Technical Indicator Scale: Bearish, Mildly Bearish, Sideways, Mildly Bullish, Bullish Turned
 Shareholding Snapshot : Mar 2026
Shareholding Compare (%holding)
Promoters
None
Held by 11 Schemes (19.43%)
Held by 27 FIIs (0.87%)
Dhanuka Laboratories Limited (69.84%)
Quant Mutual Fund - Quant Small Cap Fund (6.83%)
6.58%
Quarterly Results Snapshot (Consolidated) - Mar'26 - QoQ

QoQ Growth in quarter ended Mar 2026 is 14.64% vs 7.11% in Dec 2025
QoQ Growth in quarter ended Mar 2026 is 288.58% vs -120.45% in Dec 2025
Half Yearly Results Snapshot (Consolidated) - Sep'25

Growth in half year ended Sep 2025 is -21.55% vs 22.38% in Sep 2024
Growth in half year ended Sep 2025 is -83.50% vs 93.74% in Sep 2024
Nine Monthly Results Snapshot (Consolidated) - Dec'25
YoY Growth in nine months ended Dec 2025 is -16.18% vs 13.64% in Dec 2024
YoY Growth in nine months ended Dec 2025 is -104.23% vs 31.94% in Dec 2024
Annual Results Snapshot (Consolidated) - Mar'26
YoY Growth in year ended Mar 2026 is -12.00% vs 12.52% in Mar 2025
YoY Growth in year ended Mar 2026 is -79.38% vs 8.13% in Mar 2025
About Orchid Pharma Ltd

Company Coordinates


