
Compare Oriental Aromat. with Similar Stocks
Dashboard
Weak Long Term Fundamental Strength with a -23.01% CAGR growth in Operating Profits over the last 5 years
- The company has been able to generate a Return on Equity (avg) of 3.82% signifying low profitability per unit of shareholders funds
Flat results in Mar 26
Despite the size of the company, domestic mutual funds hold only 0% of the company
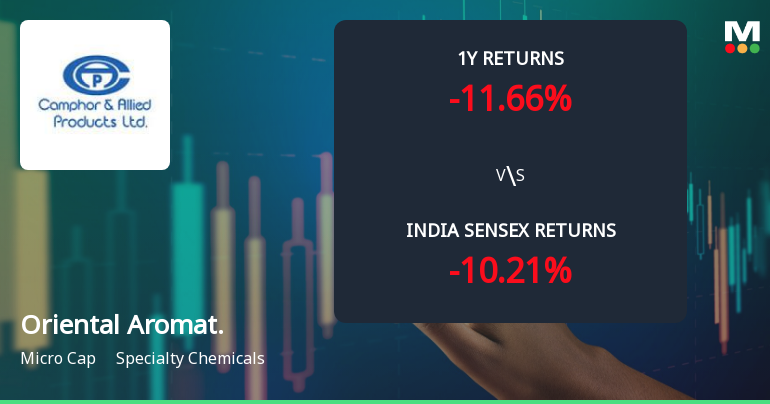
Underperformed the market in the last 1 year
Stock DNA
Specialty Chemicals
INR 1,104 Cr (Micro Cap)
331.00
41
0.16%
0.58
0.50%
1.63
Total Returns (Price + Dividend) 
Latest dividend: 0.5 per share ex-dividend date: Aug-08-2025
Risk Adjusted Returns v/s
Returns Beta

News
Oriental Aromatics Ltd Shows Signs of Mild Bullish Momentum Amid Mixed Technical Signals
Oriental Aromatics Ltd, a micro-cap player in the specialty chemicals sector, has exhibited a notable shift in price momentum, moving from a sideways trend to a mildly bullish stance. Despite a recent upgrade from a Strong Sell to a Sell rating, the stock’s technical indicators present a nuanced picture, with bullish signals on weekly and monthly charts contrasting with some bearish cues on daily moving averages. This article analyses the latest technical parameters, price action, and relative performance against the broader market to provide a comprehensive view for investors.
Read full news article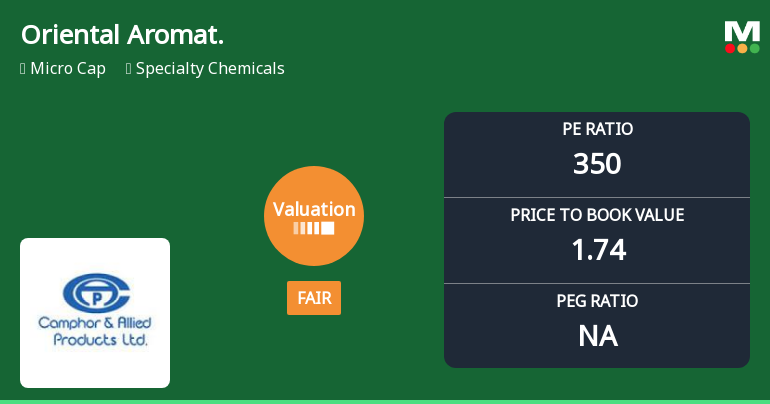
Oriental Aromatics Ltd Valuation Shifts to Fair Amid Specialty Chemicals Sector Dynamics
Oriental Aromatics Ltd, a micro-cap player in the specialty chemicals sector, has seen its valuation grade improve from attractive to fair, reflecting a notable shift in price attractiveness despite persistently high price-to-earnings multiples. This article analyses the recent valuation changes, compares the company’s metrics with peers, and assesses the implications for investors amid evolving market conditions.
Read full news article
Oriental Aromatics Ltd Upgraded to Sell on Technical Improvements Despite Weak Fundamentals
Oriental Aromatics Ltd has seen its investment rating upgraded from Strong Sell to Sell as of 9 June 2026, driven primarily by a shift in technical indicators despite persistent fundamental challenges. The micro-cap specialty chemicals company’s score rose to 34.0, reflecting a nuanced market view that balances recent price momentum against long-term financial weaknesses.
Read full news article Announcements
Announcement under Regulation 30 (LODR)-Earnings Call Transcript
26-May-2026 | Source : BSEEarnings Call Transcript
Announcement under Regulation 30 (LODR)-Newspaper Publication
21-May-2026 | Source : BSESubmission of Newspaper publication of Audited Standalone and Consolidated Financial Results
Announcement under Regulation 30 (LODR)-Investor Presentation
21-May-2026 | Source : BSEEarnings Presentation for the Quarter and Year ended 31st March 2026
Corporate Actions

No Upcoming Board Meetings

Oriental Aromatics Ltd has declared 10% dividend, ex-date: 08 Aug 25

Oriental Aromatics Ltd has announced 5:10 stock split, ex-date: 13 Dec 18

Oriental Aromatics Ltd has announced 1:1 bonus issue, ex-date: 13 Dec 18

No Rights history available
Quality key factors
Valuation key factors
Technicals key factors
 Technical Indicator Scale: Bearish, Mildly Bearish, Sideways, Mildly Bullish, Bullish Turned
 Shareholding Snapshot : Mar 2026
Shareholding Compare (%holding)
Promoters
None
Held by 0 Schemes
Held by 4 FIIs (0.0%)
Shyamal Anil Bodani (37.08%)
None
19.05%
Quarterly Results Snapshot (Consolidated) - Mar'26 - YoY

YoY Growth in quarter ended Mar 2026 is 11.54% vs 16.94% in Mar 2025

YoY Growth in quarter ended Mar 2026 is 180.99% vs -85.97% in Mar 2025
Half Yearly Results Snapshot (Consolidated) - Sep'25
Growth in half year ended Sep 2025 is 9.79% vs 7.10% in Sep 2024
Growth in half year ended Sep 2025 is -95.19% vs 811.60% in Sep 2024
Nine Monthly Results Snapshot (Consolidated) - Dec'25
YoY Growth in nine months ended Dec 2025 is 10.86% vs 8.90% in Dec 2024
YoY Growth in nine months ended Dec 2025 is -102.07% vs 3,357.43% in Dec 2024
Annual Results Snapshot (Consolidated) - Mar'26
YoY Growth in year ended Mar 2026 is 11.04% vs 10.98% in Mar 2025
YoY Growth in year ended Mar 2026 is -90.36% vs 277.25% in Mar 2025
About Oriental Aromatics Ltd

Company Coordinates


