
Compare Oriental Hotels with Similar Stocks
Stock DNA
Hotels & Resorts
INR 2,157 Cr (Small Cap)
37.00
38
0.41%
0.15
8.99%
2.83
Total Returns (Price + Dividend) 
Latest dividend: 0.5 per share ex-dividend date: Jul-17-2025
Risk Adjusted Returns v/s
Returns Beta

News

Oriental Hotels Ltd Locks at Upper Circuit With 20% Gain — Buyers Queue, Sellers Absent
At Rs 144.39, the buying was done — not because demand dried up, but because the exchange wouldn't let the stock go any higher. Oriental Hotels Ltd locked at its upper circuit of 20% on 23 Jun 2026, with buyers queuing and no sellers willing to part with shares.
Read full news article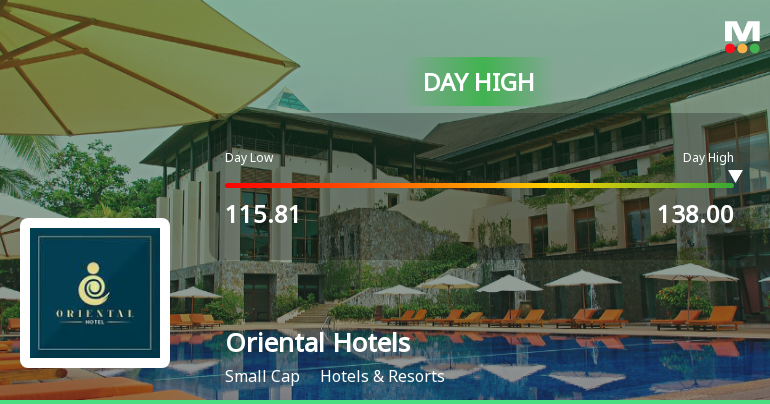
Oriental Hotels Ltd Surges 13.3% to Day's High of Rs 134.15 — Outperforms Sector by 10.28 Percentage Points
The Sensex declined 0.76% on 23 Jun 2026, while Oriental Hotels Ltd surged 13.29%, marking a remarkable 10.28-percentage-point outperformance over its Hotels & Resorts sector. This sharp intraday rally rewrites the short-term narrative for the stock, which has been on a strong upward trajectory in recent weeks.
Read full news article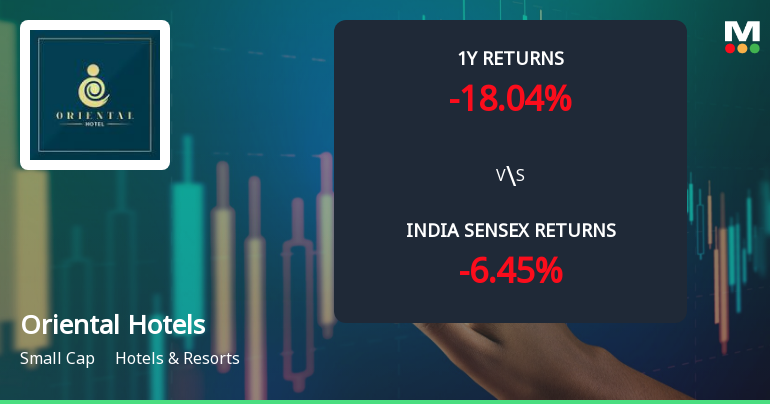
Oriental Hotels Ltd Technical Momentum Shifts Amid Mixed Indicator Signals
Oriental Hotels Ltd has experienced a notable shift in its technical momentum, moving from a sideways trend to a mildly bearish stance. Despite this, the stock’s weekly indicators suggest pockets of bullishness, reflecting a complex interplay of market forces that investors should carefully analyse.
Read full news article Announcements
Announcement under Regulation 30 (LODR)-Newspaper Publication
28-May-2026 | Source : BSEPlease find attached disclosure.
Announcement under Regulation 30 (LODR)-Retirement
22-May-2026 | Source : BSEIn accordance with Regulation 30 of the SEBI Listing Regulations we wish to inform you that Mr. Moiz Mohsin Miyajiwala (DIN: 00026258) shall retire as an Independent Director of the Company w.e.f. the end of business hours of May 23 2026 upon attaining the age of 75 years.
Announcement under Regulation 30 (LODR)-Newspaper Publication
21-May-2026 | Source : BSEPlease find attached intimation.
Corporate Actions

No Upcoming Board Meetings

Oriental Hotels Ltd has declared 50% dividend, ex-date: 17 Jul 25

Oriental Hotels Ltd has announced 1:10 stock split, ex-date: 10 Nov 10

No Bonus history available

No Rights history available
Quality key factors
Valuation key factors
Technicals key factors
 Technical Indicator Scale: Bearish, Mildly Bearish, Sideways, Mildly Bullish, Bullish Turned
 Shareholding Snapshot : Mar 2026
Shareholding Compare (%holding)
Promoters
0.125
Held by 2 Schemes (1.14%)
Held by 20 FIIs (0.36%)
The Indian Hotels Company Limited (28.54%)
Quant Mutual Fund - Quant Small Cap Fund (1.14%)
21.92%
Quarterly Results Snapshot (Consolidated) - Mar'26 - YoY

YoY Growth in quarter ended Mar 2026 is 2.97% vs 23.31% in Mar 2025

YoY Growth in quarter ended Mar 2026 is 66.98% vs 0.41% in Mar 2025
Half Yearly Results Snapshot (Consolidated) - Sep'25
Growth in half year ended Sep 2025 is 17.74% vs 0.90% in Sep 2024
Growth in half year ended Sep 2025 is 234.63% vs -62.93% in Sep 2024
Nine Monthly Results Snapshot (Consolidated) - Dec'25
YoY Growth in nine months ended Dec 2025 is 16.35% vs 7.52% in Dec 2024
YoY Growth in nine months ended Dec 2025 is 79.44% vs -34.70% in Dec 2024
Annual Results Snapshot (Consolidated) - Mar'26
YoY Growth in year ended Mar 2026 is 12.31% vs 11.84% in Mar 2025
YoY Growth in year ended Mar 2026 is 73.30% vs -21.03% in Mar 2025
About Oriental Hotels Ltd

Company Coordinates


