
Compare Oriental Trimex with Similar Stocks
Dashboard
Weak Long Term Fundamental Strength with an average Return on Equity (ROE) of 0.46%
- Poor long term growth as Net Sales has grown by an annual rate of 3.03% and Operating profit at 9.02% over the last 5 years
- Company's ability to service its debt is weak with a poor EBIT to Interest (avg) ratio of -2.41
Flat results in Mar 26
Underperformed the market in the last 1 year
Stock DNA
Diversified consumer products
INR 49 Cr (Micro Cap)
20.00
21
0.00%
0.01
2.30%
0.47
Total Returns (Price + Dividend) 
Oriental Trimex for the last several years.
Risk Adjusted Returns v/s
Returns Beta

News

Oriental Trimex Ltd is Rated Strong Sell
Oriental Trimex Ltd is rated Strong Sell by MarketsMOJO, with this rating last updated on 01 June 2026. However, the analysis and financial metrics presented here reflect the stock’s current position as of 04 June 2026, providing investors with the latest insights into the company’s performance and outlook.
Read full news article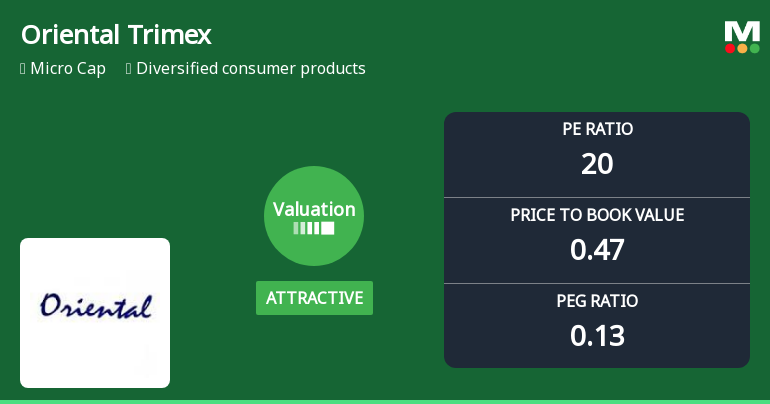
Oriental Trimex Ltd Valuation Shifts Signal Changing Market Perception
Oriental Trimex Ltd has witnessed a notable improvement in its valuation parameters, shifting from a very attractive to an attractive price level, despite ongoing challenges in stock performance and returns relative to the broader market. This article analyses the recent changes in key valuation metrics, compares them with peer averages and historical benchmarks, and assesses the implications for investors navigating the diversified consumer products sector.
Read full news articleAre Oriental Trimex Ltd latest results good or bad?
Oriental Trimex Ltd's latest financial results for Q4 FY26 reveal a significant degree of volatility in its operational performance. The company reported net sales of ₹13.94 crores, reflecting a quarter-on-quarter growth of 321.15% from ₹3.31 crores in Q3 FY26. However, this sharp increase comes after a year-on-year decline of 16.33% from ₹16.66 crores in Q4 FY25, raising concerns about the sustainability of such revenue levels. Net profit for the quarter was ₹1.32 crores, which represents a remarkable quarter-on-quarter increase of 1,100.00% compared to ₹0.11 crores in the previous quarter. In contrast, the year-on-year comparison shows a substantial decrease of 77.89% from ₹5.97 crores in Q4 FY25. The profit after tax margin improved to 9.47% from 3.32% in Q3 FY26 but remains significantly lower than the 35.83% achieved in the same quarter last year. The operating profit margin, excluding other income, ...
Read full news article Announcements
Announcement under Regulation 30 (LODR)-Cessation
08-Jun-2026 | Source : BSEWe wish to inform you that Mr. Dinesh Narang Non-Executive and Independent Director has tendered his resignation w.e.f. June 08 2026
Announcement under Regulation 30 (LODR)-Newspaper Publication
01-Jun-2026 | Source : BSEWe hereby enclosing the Newspaper clippings of financial result for the year ended 31st March 2026
Outcome Of The Board Meeting And Submission Of Audited Financial Results For The Quarter And Year Ended 31St March 2026 Pursuant To Regulation 30 And Regulation 33 Of The SEBI (Listing Obligations And Disclosure Requirements) Regulations 2015.
30-May-2026 | Source : BSEWe are hereby attaching Financial Result for the year ended 31st March 2026 which has been approved in Board Meeting held on 30th May 2026.
Corporate Actions

No Upcoming Board Meetings

No Dividend history available

No Splits history available

No Bonus history available

Oriental Trimex Ltd has announced 3:2 rights issue, ex-date: 05 Sep 24
Quality key factors
Valuation key factors
Technicals key factors
 Technical Indicator Scale: Bearish, Mildly Bearish, Sideways, Mildly Bullish, Bullish Turned
 Shareholding Snapshot : Mar 2026
Shareholding Compare (%holding)
Non Institution
12.4997
Held by 0 Schemes
Held by 0 FIIs
Rajesh Kumar Punia (17.4%)
Bindesh Kurani (2.99%)
64.1%
Quarterly Results Snapshot (Standalone) - Mar'26 - QoQ

QoQ Growth in quarter ended Mar 2026 is 321.15% vs 48.43% in Dec 2025
QoQ Growth in quarter ended Mar 2026 is 1,100.00% vs 147.83% in Dec 2025
Half Yearly Results Snapshot (Standalone) - Sep'25

Growth in half year ended Sep 2025 is 58.47% vs 490.48% in Sep 2024
Growth in half year ended Sep 2025 is 121.56% vs -826.09% in Sep 2024
Nine Monthly Results Snapshot (Standalone) - Dec'25
YoY Growth in nine months ended Dec 2025 is 66.06% vs 592.06% in Dec 2024
YoY Growth in nine months ended Dec 2025 is -81.85% vs 375.53% in Dec 2024
Annual Results Snapshot (Standalone) - Mar'26
YoY Growth in year ended Mar 2026 is 0.76% vs 475.89% in Mar 2025
YoY Growth in year ended Mar 2026 is -79.11% vs 231.85% in Mar 2025
About Oriental Trimex Ltd

Company Coordinates


