
Compare Orissa Minerals with Similar Stocks
Dashboard
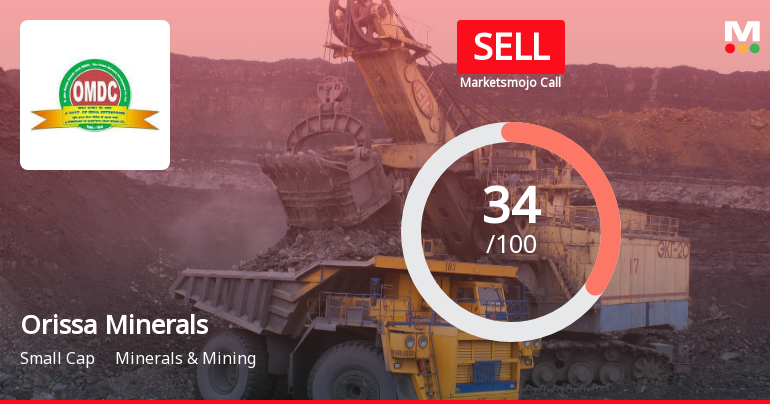
With a Negative Book Value, the company has a Weak Long Term Fundamental Strength
- Poor long term growth as Net Sales has grown by an annual rate of 135.76% and Operating profit at 0% over the last 5 years
- The company has a negative book value of Rs 51.58 crore
Risky - Negative EBITDA
Underperformed the market in the last 1 year
Stock DNA
Minerals & Mining
INR 2,479 Cr (Small Cap)
NA (Loss Making)
32
0.00%
-2.39
51.86%
-49.14
Total Returns (Price + Dividend) 
Latest dividend: 1.46 per share ex-dividend date: Sep-07-2017
Risk Adjusted Returns v/s
Returns Beta

News
Orissa Minerals Development Company Ltd Upgraded to Sell on Technical Improvements
Orissa Minerals Development Company Ltd has seen its investment rating upgraded from Strong Sell to Sell, driven primarily by a shift in technical indicators despite persistent fundamental weaknesses. The company’s recent quarterly financial performance showed promise, yet long-term concerns remain due to negative book value and deteriorating profitability. This article analyses the four key parameters—Quality, Valuation, Financial Trend, and Technicals—that influenced the rating change on 17 June 2026.
Read full news article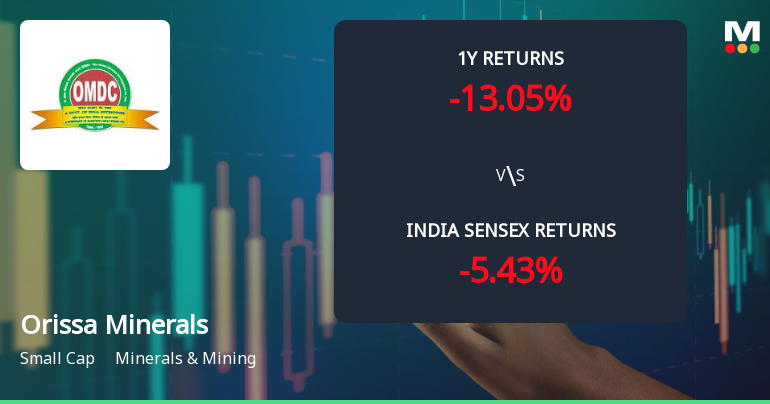
Orissa Minerals Development Company Ltd Sees Technical Momentum Shift Amid Mixed Market Signals
Orissa Minerals Development Company Ltd (OMDC) has experienced a notable shift in its technical momentum, moving from a mildly bearish stance to a sideways trend as of mid-June 2026. Despite a modest day gain of 2.43%, the stock’s technical indicators present a complex picture, with weekly signals showing mild bullishness contrasting with monthly bearish tendencies. This nuanced technical landscape warrants a detailed analysis for investors seeking clarity on the stock’s near-term trajectory.
Read full news article
Orissa Minerals Development Company Ltd Sees Mixed Technical Signals Amid Price Momentum Shift
Orissa Minerals Development Company Ltd (OMDC) has experienced a nuanced shift in its technical parameters, reflecting a complex interplay of bullish and bearish signals. Despite a recent 4.13% rise in the stock price to ₹4,010.20, the overall technical outlook remains cautious, with key indicators presenting a mixed picture that investors should carefully analyse.
Read full news article Announcements
Compliances-Reg.24(A)-Annual Secretarial Compliance
30-May-2026 | Source : BSEAnnual Secretarial Compliances
Appointment Of Non-Executive Chairman
26-May-2026 | Source : BSEAppointment of Non-executive Chairman
Order Of The Honble Supreme Court
14-May-2026 | Source : BSEOrder of the Honble Supreme Court
Corporate Actions

No Upcoming Board Meetings

Orissa Minerals Development Company Ltd has declared 146% dividend, ex-date: 07 Sep 17

Orissa Minerals Development Company Ltd has announced 1:10 stock split, ex-date: 29 Oct 12

No Bonus history available

No Rights history available
Quality key factors
Valuation key factors
Technicals key factors
 Technical Indicator Scale: Bearish, Mildly Bearish, Sideways, Mildly Bullish, Bullish Turned
 Shareholding Snapshot : Mar 2026
Shareholding Compare (%holding)
Promoters
None
Held by 1 Schemes (2.94%)
Held by 12 FIIs (0.74%)
Eastern Investments Limited (50.01%)
Lici Asm Non Par (6.55%)
25.66%
Quarterly Results Snapshot (Standalone) - Dec'25 - YoY

YoY Growth in quarter ended Dec 2025 is -0.05% vs -27.09% in Dec 2024
YoY Growth in quarter ended Dec 2025 is 157.94% vs -422.84% in Dec 2024
Half Yearly Results Snapshot (Standalone) - Sep'25

Growth in half year ended Sep 2025 is 19.43% vs 86.11% in Sep 2024
Growth in half year ended Sep 2025 is 127.13% vs 90.07% in Sep 2024
Nine Monthly Results Snapshot (Standalone) - Dec'25
YoY Growth in nine months ended Dec 2025 is 12.49% vs 19.83% in Dec 2024
YoY Growth in nine months ended Dec 2025 is 153.42% vs 17.71% in Dec 2024
Annual Results Snapshot (Standalone) - Mar'25
YoY Growth in year ended Mar 2025 is -21.46% vs 131.58% in Mar 2024
YoY Growth in year ended Mar 2025 is -1,526.24% vs 117.05% in Mar 2024
About Orissa Minerals Development Company Ltd

Company Coordinates


