
Compare Orissa Minerals with Similar Stocks
Dashboard
With a Negative Book Value, the company has a Weak Long Term Fundamental Strength
- Poor long term growth as Net Sales has grown by an annual rate of 135.76% and Operating profit at 0% over the last 5 years
- The company has a negative book value of Rs 51.58 crore
Risky - Negative EBITDA
Underperformed the market in the last 1 year
Stock DNA
Minerals & Mining
INR 2,474 Cr (Small Cap)
NA (Loss Making)
32
0.00%
-2.39
51.86%
-46.44
Total Returns (Price + Dividend) 
Latest dividend: 1.46 per share ex-dividend date: Sep-07-2017
Risk Adjusted Returns v/s
Returns Beta

News

Orissa Minerals Development Company Ltd Sees Mixed Technical Signals Amid Price Momentum Shift
Orissa Minerals Development Company Ltd (OMDC) has experienced a nuanced shift in its technical parameters, reflecting a complex interplay of bullish and bearish signals. Despite a recent 4.13% rise in the stock price to ₹4,010.20, the overall technical outlook remains cautious, with key indicators presenting a mixed picture that investors should carefully analyse.
Read full news article
Orissa Minerals Development Company Ltd Faces Bearish Momentum Amid Technical Downturn
Orissa Minerals Development Company Ltd (OMDC) has experienced a notable shift in its technical momentum, with key indicators signalling a bearish trend. Despite a strong historical performance over the longer term, recent price action and technical parameters suggest increasing downside risks for this small-cap player in the Minerals & Mining sector.
Read full news article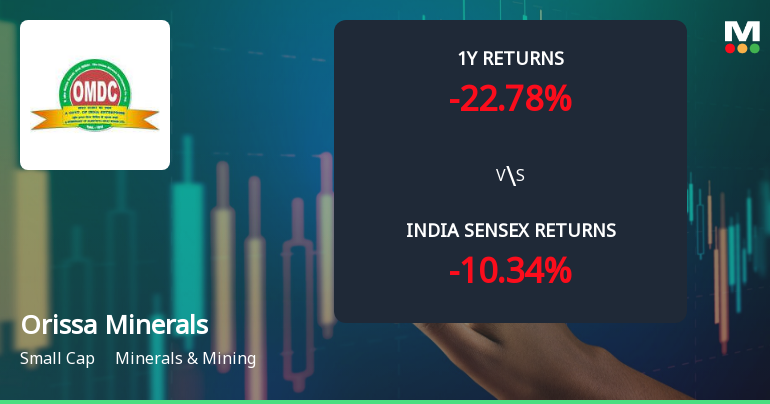
Orissa Minerals Development Company Ltd: Technical Momentum Shifts Amid Lingering Bearish Sentiment
Orissa Minerals Development Company Ltd (OMDC) has experienced a nuanced shift in its technical momentum, reflecting a complex interplay of mildly bullish and bearish signals across key indicators. Despite a modest daily price gain of 0.99%, the stock remains under pressure with a strong sell rating, underscoring challenges in the minerals and mining sector amid broader market headwinds.
Read full news article Announcements
Compliances-Reg.24(A)-Annual Secretarial Compliance
30-May-2026 | Source : BSEAnnual Secretarial Compliances
Appointment Of Non-Executive Chairman
26-May-2026 | Source : BSEAppointment of Non-executive Chairman
Order Of The Honble Supreme Court
14-May-2026 | Source : BSEOrder of the Honble Supreme Court
Corporate Actions

No Upcoming Board Meetings

Orissa Minerals Development Company Ltd has declared 146% dividend, ex-date: 07 Sep 17

Orissa Minerals Development Company Ltd has announced 1:10 stock split, ex-date: 29 Oct 12

No Bonus history available

No Rights history available
Quality key factors
Valuation key factors
Technicals key factors
 Technical Indicator Scale: Bearish, Mildly Bearish, Sideways, Mildly Bullish, Bullish Turned
 Shareholding Snapshot : Mar 2026
Shareholding Compare (%holding)
Promoters
None
Held by 1 Schemes (2.94%)
Held by 12 FIIs (0.74%)
Eastern Investments Limited (50.01%)
Lici Asm Non Par (6.55%)
25.66%
Quarterly Results Snapshot (Standalone) - Dec'25 - YoY

YoY Growth in quarter ended Dec 2025 is -0.05% vs -27.09% in Dec 2024
YoY Growth in quarter ended Dec 2025 is 157.94% vs -422.84% in Dec 2024
Half Yearly Results Snapshot (Standalone) - Sep'25

Growth in half year ended Sep 2025 is 19.43% vs 86.11% in Sep 2024
Growth in half year ended Sep 2025 is 127.13% vs 90.07% in Sep 2024
Nine Monthly Results Snapshot (Standalone) - Dec'25
YoY Growth in nine months ended Dec 2025 is 12.49% vs 19.83% in Dec 2024
YoY Growth in nine months ended Dec 2025 is 153.42% vs 17.71% in Dec 2024
Annual Results Snapshot (Standalone) - Mar'25
YoY Growth in year ended Mar 2025 is -21.46% vs 131.58% in Mar 2024
YoY Growth in year ended Mar 2025 is -1,526.24% vs 117.05% in Mar 2024
About Orissa Minerals Development Company Ltd

Company Coordinates


