
Compare Orosil Smiths with Similar Stocks
Stock DNA
Gems, Jewellery And Watches
INR 26 Cr (Micro Cap)
1.00
52
0.00%
-0.17
90.52%
1.04
Total Returns (Price + Dividend) 
Orosil Smiths for the last several years.
Risk Adjusted Returns v/s
Returns Beta

News

Orosil Smiths India Ltd is Rated Sell
Orosil Smiths India Ltd is rated 'Sell' by MarketsMOJO, with this rating last updated on 06 April 2026. However, the analysis and financial metrics discussed here reflect the stock's current position as of 10 July 2026, providing investors with an up-to-date view of its fundamentals, returns, and market standing.
Read full news article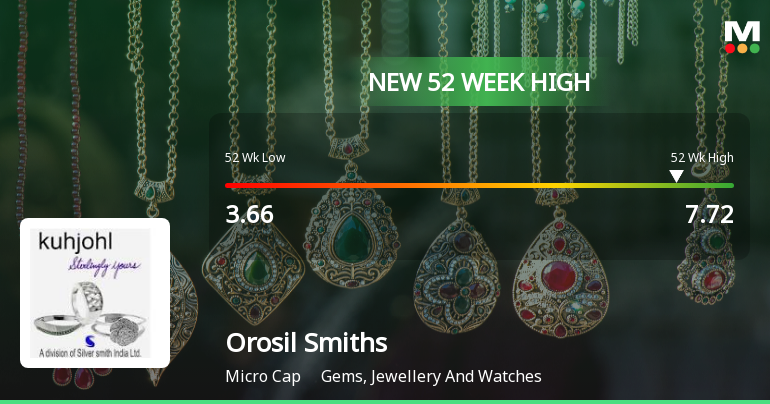
Broad-Based Technical Strength Lifts Orosil Smiths India Ltd to 52-Week High of Rs 7.72
Surging to a fresh 52-week high of Rs 7.72 on 15 Jun 2026, Orosil Smiths India Ltd has demonstrated remarkable price momentum, outperforming its sector by 4.9% in a single session and extending a six-day winning streak that has delivered a 20.89% return over this period.
Read full news article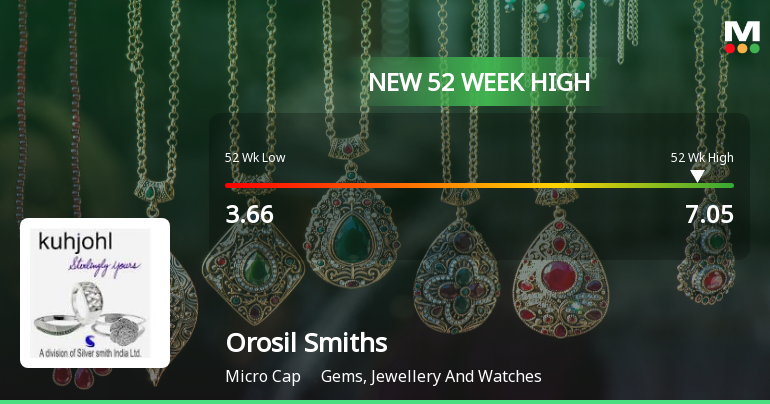
Broad-Based Technical Strength Lifts Orosil Smiths India Ltd to 52-Week High of Rs 7.05
Surging to a fresh 52-week high of Rs 7.05 on 12 Jun 2026, Orosil Smiths India Ltd has demonstrated remarkable price momentum, outperforming its sector by 8.03% in a single session and extending a five-day winning streak that has delivered nearly 16% returns. This rally has propelled the stock well above all key moving averages, signalling robust technical strength amid a broader market environment where the Sensex trades near its 52-week low.
Read full news article Announcements
Compliances-Certificate under Reg. 74 (5) of SEBI (DP) Regulations 2018
14-Jul-2026 | Source : BSEPlease find enclosed
Closure of Trading Window
22-Jun-2026 | Source : BSEPlease find attached
Disclosures under Reg. 29(2) of SEBI (SAST) Regulations 2011
19-Jun-2026 | Source : BSEThe Exchange has received the disclosure under Regulation 29(2) of SEBI (Substantial Acquisition of Shares & Takeovers) Regulations 2011 for B K Narula HUF
Corporate Actions

No Upcoming Board Meetings

No Dividend history available

Orosil Smiths India Ltd has announced 1:5 stock split, ex-date: 24 Aug 17

No Bonus history available

No Rights history available
Quality key factors
Valuation key factors
Technicals key factors
 Technical Indicator Scale: Bearish, Mildly Bearish, Sideways, Mildly Bullish, Bullish Turned
 Shareholding Snapshot : Mar 2026
Shareholding Compare (%holding)
Promoters
None
Held by 0 Schemes
Held by 0 FIIs
B.k.narula (17.26%)
Nam Securities Limited (4.84%)
22.4%
Quarterly Results Snapshot (Standalone) - Mar'26 - QoQ

QoQ Growth in quarter ended Mar 2026 is 24.39% vs -51.76% in Dec 2025
QoQ Growth in quarter ended Mar 2026 is 32,557.14% vs -129.17% in Dec 2025
Half Yearly Results Snapshot (Standalone) - Sep'25
Growth in half year ended Sep 2025 is 1,630.00% vs -44.44% in Sep 2024
Growth in half year ended Sep 2025 is 212.50% vs 7.69% in Sep 2024
Nine Monthly Results Snapshot (Standalone) - Dec'25
YoY Growth in nine months ended Dec 2025 is 494.44% vs -5.26% in Dec 2024
YoY Growth in nine months ended Dec 2025 is 195.24% vs 36.36% in Dec 2024
Annual Results Snapshot (Standalone) - Mar'26

YoY Growth in year ended Mar 2026 is -5.69% vs 462.00% in Mar 2025
YoY Growth in year ended Mar 2026 is 3,657.38% vs 248.78% in Mar 2025
About Orosil Smiths India Ltd

Company Coordinates


