
Compare Oswal Agro Mills with Similar Stocks
Dashboard
Poor Management Efficiency with a low ROE of 3.53%
- The company has been able to generate a Return on Equity (avg) of 3.53% signifying low profitability per unit of shareholders funds
Poor long term growth as Net Sales has grown by an annual rate of -8.03% over the last 5 years
Negative results in Mar 26
With ROE of -1.8, it has a Very Expensive valuation with a 0.6 Price to Book Value
Despite the size of the company, domestic mutual funds hold only 0.02% of the company
Below par performance in long term as well as near term
Stock DNA
Trading & Distributors
INR 564 Cr (Micro Cap)
NA (Loss Making)
92
0.00%
-0.19
-1.82%
0.63
Total Returns (Price + Dividend) 
Oswal Agro Mills for the last several years.
Risk Adjusted Returns v/s
Returns Beta

News

Oswal Agro Mills Ltd Locks at Upper Circuit With 3.65% Gain — Buyers Queue, Sellers Absent
At Rs 44.57, the buying was done — not because demand dried up, but because the exchange wouldn't let the stock go any higher. Oswal Agro Mills Ltd locked at its upper circuit of 3.65% on 11 Jun 2026, with buyers queuing and no sellers willing to part with shares.
Read full news article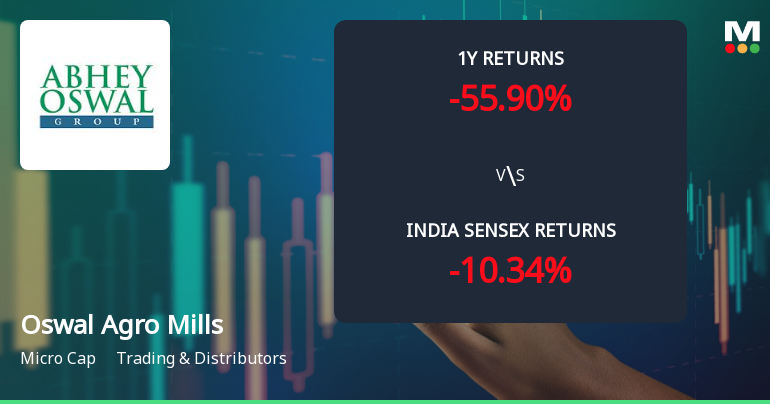
Oswal Agro Mills Ltd Technical Momentum Shifts Amid Bearish Outlook
Oswal Agro Mills Ltd, a micro-cap player in the Trading & Distributors sector, has experienced a notable shift in its technical momentum, signalling increased bearish pressure. Despite a modest day gain of 3.52% to close at ₹42.98, the stock’s broader technical indicators reveal a deteriorating outlook, with key metrics such as MACD, Bollinger Bands, and moving averages pointing towards sustained weakness.
Read full news article
Oswal Agro Mills Ltd Technical Momentum Shifts Amid Bearish Sentiment
Oswal Agro Mills Ltd, a micro-cap player in the Trading & Distributors sector, has experienced a notable shift in its technical momentum, reflecting a complex interplay of bearish and mildly bullish signals. Despite a recent downgrade to a Strong Sell rating by MarketsMOJO, the stock’s technical indicators reveal nuanced trends that merit close attention from investors navigating volatile market conditions.
Read full news article Announcements
Compliances-Reg.24(A)-Annual Secretarial Compliance
29-May-2026 | Source : BSESubmission of Annual Secretarial Compliance Report under Regulation 24A of SEBI (Listing Obligations & Disclosure Requirements) Regulations 2015 for the year ended March 31 2026
Board Meeting Outcome for Outcome Of Board Meeting
26-May-2026 | Source : BSESubmission of audited financial results for the quarter and year ended March 31 2026
Announcement under Regulation 30 (LODR)-Newspaper Publication
22-May-2026 | Source : BSESubmission of Newspaper Publication of notice to shareholder about special window for transfer and dematerialisation of physical securities.
Corporate Actions

No Upcoming Board Meetings

No Dividend history available

No Splits history available

No Bonus history available

No Rights history available
Quality key factors
Valuation key factors
Technicals key factors
 Technical Indicator Scale: Bearish, Mildly Bearish, Sideways, Mildly Bullish, Bullish Turned
 Shareholding Snapshot : Mar 2026
Shareholding Compare (%holding)
Promoters
None
Held by 6 Schemes (0.01%)
Held by 2 FIIs (0.03%)
Mrs Aruna Oswal (41.74%)
Alliance Techno Projects Ltd (3.97%)
33.45%
Quarterly Results Snapshot (Consolidated) - Mar'26 - YoY

YoY Growth in quarter ended Mar 2026 is -99.98% vs 15,785.48% in Mar 2025
YoY Growth in quarter ended Mar 2026 is -172.26% vs 5,436.84% in Mar 2025
Half Yearly Results Snapshot (Consolidated) - Sep'25

Growth in half year ended Sep 2025 is 2,274.07% vs 0.00% in Sep 2024
Growth in half year ended Sep 2025 is 229.85% vs 61.94% in Sep 2024
Nine Monthly Results Snapshot (Consolidated) - Dec'25
YoY Growth in nine months ended Dec 2025 is -69.59% vs 4,961.60% in Dec 2024
YoY Growth in nine months ended Dec 2025 is -52.54% vs 1,349.27% in Dec 2024
Annual Results Snapshot (Consolidated) - Mar'26
YoY Growth in year ended Mar 2026 is -88.09% vs 8,550.80% in Mar 2025
YoY Growth in year ended Mar 2026 is -119.52% vs 2,369.15% in Mar 2025
About Oswal Agro Mills Ltd

Company Coordinates


