P&G Hygiene

INR
7,934.80
-53.55 (-0.67%)
BSENSE

Sep 01, 01:12 PM

BSE+NSE Vol: 7.99 k

  • Price Points
  • Score
  • Mojo Parameters
  • Total Return
  • News and Corporate Actions
  • Key factors
  • Shareholding
  • Financials
  • CompanyCV
stock-summaryPrice Point
High/Low

1Day

52 Week

Valuation
Technical
Day's Volume

CASH

7.99 k (35.94%) Volume

Shareholding (Jun 2026)

FII

0.98%

Held by 100 FIIs

DII

15.58%

Held by 17 DIIs

Promoter

70.64%

Why is Procter & Gamble Hygiene & Health Care Ltd. falling/rising?

01-Sep-2026

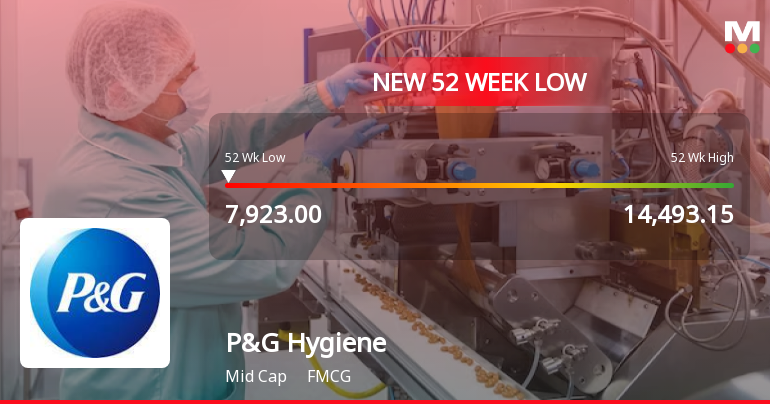
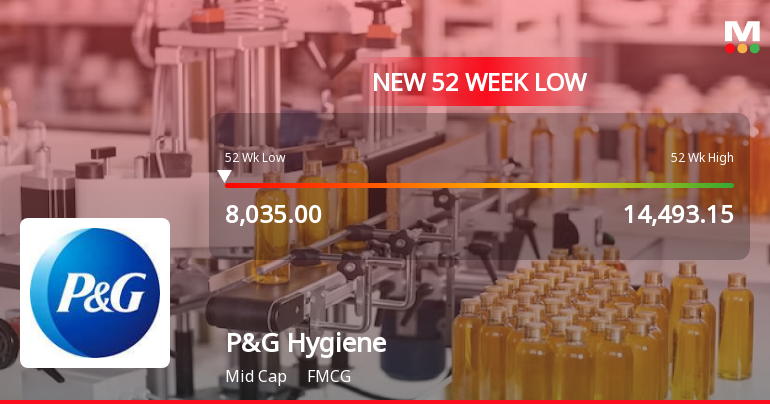
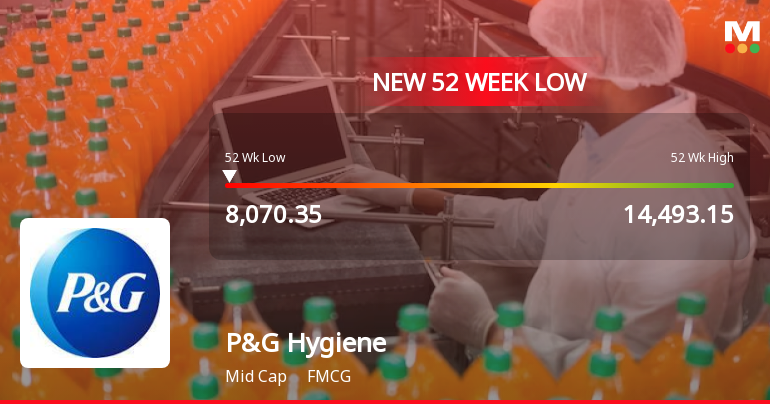
As of 31-Aug, Procter & Gamble Hygiene & Health Care Ltd. is facing a stock price decline to 7,988.35, down 1.33%. This drop is due to significant underperformance compared to benchmarks, disappointing financial results, and negative market sentiment.

As of 31-Aug, Procter & Gamble Hygiene & Health Care Ltd. is experiencing a decline in its stock price, currently at 7,988.35, which reflects a change of -107.55 (-1.33%). This downward movement is attributed to several factors highlighted in the recent performance data. <BR><BR>The stock has underperformed significantly over various time frames, with a year-to-date decline of -38.26% compared to a -9.70% drop in the benchmark index, Sensex. Over the past year, the stock has fallen by -39.00%, while the Sensex has only decreased by -3.57%. Additionally, the stock has hit a new 52-week low of Rs.7975.05 today, indicating a persistent downward trend.<BR><BR>The stock has been losing value for the last three consecutive days, with a total decline of -1.67% during this period. It is also trading below its moving averages across multiple time frames, including the 5-day, 20-day, 50-day, 100-day, and 200-day averages, which typically signals a bearish trend. Furthermore, there has been a decrease in investor participation, as evidenced by a drop in delivery volume by -1.29% against the 5-day average.<BR><BR>Financially, the company has shown poor long-term growth, with net sales growing at an annual rate of only 3.50% and operating profit at 4.39% over the last five years. Recent quarterly results have also been disappointing, with a significant decline in profit before tax and profit after tax, as well as the lowest net sales recorded. Despite having a high return on equity (ROE) of 82.27% and being net-debt free, the stock's valuation appears expensive with a price-to-book value of 34.4, which may deter potential investors.<BR><BR>In summary, the combination of consistent underperformance against benchmarks, disappointing financial results, and negative market sentiment has contributed to the decline in Procter & Gamble Hygiene & Health Care Ltd.'s stock price.

View full answer

Who are in the management team of P&G Hygiene?

01-Sep-2026

The management team of P&G Hygiene includes Chairman Chittranjan Dua, Managing Director L. V. Vaidyanathan, and several directors, including A K Gupta, Meena Ganesh, and Gurcharan Das, among others, bringing diverse expertise to the company.

The management team of P&G Hygiene includes the following individuals:<BR><BR>1. **Chittranjan Dua** - Chairman & Independent Director<BR>2. **Ghanashyam Hedge** - Executive Director & Secretary<BR>3. **L. V. Vaidyanathan** - Managing Director<BR>4. **A K Gupta** - Independent Director<BR>5. **Meena Ganesh** - Independent Director<BR>6. **Krishnamurthy Narayanan Iyer** - Independent Director<BR>7. **Pramod Agarwal** - Director<BR>8. **Sonali Dhawan** - Director<BR>9. **Karthik Natarajan** - Director<BR>10. **Gagan Sawhney** - Director<BR>11. **Gurcharan Das** - Independent Director<BR><BR>This team brings a diverse range of expertise and leadership to the company.

View full answer

What does P&G Hygiene do?

01-Sep-2026

Procter & Gamble Hygiene and Health Care Limited (P&GHHCL) manufactures and sells branded FMCG products in the femcare and healthcare sectors, with a market cap of INR 26,267 Cr and a net profit of 126 Cr as of June 2026. Key metrics include a P/E ratio of 33.00 and a dividend yield of 3.21%.

Overview:<BR>Procter & Gamble Hygiene and Health Care Limited (P&GHHCL) is engaged in manufacturing and selling branded packaged fast moving consumer goods in the femcare and healthcare businesses, operating within the FMCG industry and categorized as a mid-cap company.<BR><BR>History:<BR>P&GHHCL was incorporated in an unspecified year and has maintained its status as a manufacturer and seller of FMCG products. The latest quarterly results reported are for June 2026, showcasing the company's performance in net sales and profit.<BR><BR>Financial Snapshot:<BR>- Net Sales: 890 Cr (Quarterly Results - Jun 2026)<BR>- Net Profit: 126 Cr (Quarterly Results - Jun 2026)<BR>- Market Cap: INR 26,267 Cr (Mid Cap)<BR><BR>Key Metrics:<BR>- P/E: 33.00<BR>- Industry P/E: 44<BR>- Dividend Yield: 3.21%<BR>- Debt Equity: -0.75<BR>- Return on Equity: 104.94%<BR>- Price to Book: 34.86<BR><BR>Contact Details:<BR>- Address: P & G Plaza Chakala, Cardinal Gracias Rd Andheri(E) Mumbai Maharashtra : 400099<BR>- Tel: 91-22-28266000<BR>- Email: investorpghh.i@pg.com<BR>- Website: http://www.in.pg.com

View full answer

Who are the peers of the P&G Hygiene?

01-Sep-2026

P&G Hygiene's peers include Godrej Consumer, Dabur India, Colgate-Palmoliv, Cupid, Godfrey Phillips, Hatsun Agro, Gillette India, Zydus Wellness, and Emami. Management risk varies from excellent to below average across these companies, with growth generally rated below average, while Cupid has the highest 1-year return at 713.83% and P&G Hygiene's return is -39.00%.

Peers: The peers of P&G Hygiene are Godrej Consumer, Dabur India, Colgate-Palmoliv, Cupid, Godfrey Phillips, Hatsun Agro, Gillette India, Zydus Wellness, and Emami.<BR><BR>Quality Snapshot: Excellent management risk is observed at Colgate-Palmoliv, Godfrey Phillips, Gillette India, and Emami, while Good management risk is found at Godrej Consumer, Dabur India, and Hatsun Agro. Average management risk is present at Cupid and Zydus Wellness, while the rest have Below Average management risk. Growth is rated as Excellent for Godfrey Phillips and Good for Cupid, while Below Average growth is noted for Godrej Consumer, Dabur India, Colgate-Palmoliv, P&G Hygiene, Hatsun Agro, Gillette India, Emami, and the rest. Capital Structure is rated Excellent for Godrej Consumer, Dabur India, Colgate-Palmoliv, Cupid, Godfrey Phillips, P&G Hygiene, Gillette India, and Zydus Wellness, while Average is noted for Hatsun Agro and the rest have Below Average.<BR><BR>Return Snapshot: Cupid has the highest 1-year return at 713.83%, while Godfrey Phillips has the lowest at -42.59%, with P&G Hygiene's 1-year return at -39.00%, indicating it is slightly better than Godfrey Phillips. Additionally, the six-month return is negative for Godrej Consumer, Dabur India, P&G Hygiene, Godfrey Phillips, Emami, and Gillette India.

View full answer

How big is P&G Hygiene?

01-Sep-2026

As of 31st August, Procter & Gamble Hygiene & Health Care Ltd. has a market capitalization of 26,267.00 Cr, with recent net sales of 4,236.35 Cr and a net profit of 790.72 Cr.

As of 31st August, Procter & Gamble Hygiene & Health Care Ltd. has a market capitalization of 26,267.00 Cr, categorizing it as a Mid Cap company.<BR><BR>In the latest four quarters, the company reported Net Sales of 4,236.35 Cr and a Net Profit of 790.72 Cr.<BR><BR>The latest annual period for the balance sheet is March 2025, with Shareholder's Funds amounting to 736.99 Cr and Total Assets valued at 1,672.31 Cr.

View full answer

Are Procter & Gamble Hygiene & Health Care Ltd. latest results good or bad?

30-Jul-2026

Procter & Gamble Hygiene & Health Care Ltd.'s latest results are concerning, with a 34.27% decline in net profit and a 4.84% drop in revenue year-on-year, indicating significant operational challenges and declining profitability. The operating margin has also contracted sharply, reflecting increased competitive pressures.

The latest results for Procter & Gamble Hygiene & Health Care Ltd. are concerning. In the first quarter of FY27, the company reported a net profit of ₹126.27 crores, which represents a significant decline of 34.27% compared to the same quarter last year. Revenue also fell by 4.84% year-on-year, totaling ₹889.92 crores, marking the lowest quarterly revenue recorded in recent periods.<BR><BR>Additionally, the operating margin has contracted sharply to 19.11%, down from 28.46% in the previous year, indicating increased competitive pressures and potential pricing challenges. The profit after tax margin also decreased to 14.19%, down from 20.54% a year ago.<BR><BR>Overall, these results reflect a troubling trend of declining profitability and revenue, suggesting that the company is facing significant operational challenges. The combination of reduced sales, margin compression, and a negative financial trend points to a difficult environment for Procter & Gamble Hygiene & Health Care Ltd. at this time.

View full answer

Should I buy, sell or hold Procter & Gamble Hygiene & Health Care Ltd.?

30-Jul-2026

Has Procter & Gamble Hygiene & Health Care Ltd. declared dividend?

01-Feb-2026

Yes, Procter & Gamble Hygiene & Health Care Ltd. has declared a dividend of 1700% (₹65 per share), with an ex-date of February 5, 2026. Despite the significant dividend, total returns have been negative over shorter periods, improving in the long term.

Procter & Gamble Hygiene & Health Care Ltd. has declared a dividend.<BR><BR>Dividend Details:<BR>- Percentage announced: 1700%<BR>- Amount per share: 65<BR>- Ex-date: 05 Feb 26<BR><BR>Dividend Yield: 1.49%.<BR><BR>Total Returns by Period:<BR>In the 3-month period, the price return was -11.01%, the dividend return was 0.19%, resulting in a total return of -10.82%.<BR><BR>In the 6-month period, the price return was -14.1%, the dividend return was 0.68%, leading to a total return of -13.42%.<BR><BR>For the 1-year period, the price return was -17.41%, the dividend return was 1.38%, culminating in a total return of -16.03%.<BR><BR>Over the 2-year period, the price return was -30.52%, the dividend return was 1.80%, resulting in a total return of -28.72%.<BR><BR>In the 3-year period, the price return was -13.29%, the dividend return was 3.36%, leading to a total return of -9.93%.<BR><BR>During the 4-year period, the price return was -17.88%, the dividend return was 3.91%, culminating in a total return of -13.97%.<BR><BR>In the 5-year period, the price return was 5.2%, the dividend return was 7.14%, resulting in a total return of 12.34%.<BR><BR>Overall, while Procter & Gamble Hygiene & Health Care Ltd. has declared a significant dividend, the total returns over various periods indicate a trend of negative performance, particularly in the shorter time frames, with a more favorable outcome in the longer term.

View full answer

Has Procter & Gamble Hygiene & Health Care Ltd. declared dividend?

01-Feb-2026

Yes, Procter & Gamble Hygiene & Health Care Ltd. has declared a dividend of 1700% (₹65 per share) with an ex-date of August 28, 2025. Despite this, the company has experienced negative total returns over the past 1 to 4 years, though it showed a positive return of 12.34% over the last 5 years.

Procter & Gamble Hygiene & Health Care Ltd. has declared a dividend.<BR><BR>Dividend Details:<BR>- Percentage announced: 1700%<BR>- Amount per share: 65<BR>- Ex-date: Aug-28-2025<BR><BR>Dividend Yield: 1.49%.<BR><BR>Total Returns by Period:<BR>Over the past 3 months, the price return was -11.01%, the dividend return was 0.19%, resulting in a total return of -10.82%.<BR><BR>In the last 6 months, the price return decreased by -14.1%, with a dividend return of 0.68%, leading to a total return of -13.42%.<BR><BR>For the 1-year period, the price return was -17.41%, the dividend return was 1.38%, culminating in a total return of -16.03%.<BR><BR>Over 2 years, the price return fell by -30.52%, the dividend return was 1.80%, resulting in a total return of -28.72%.<BR><BR>In the 3-year period, the price return was -13.29%, the dividend return was 3.36%, leading to a total return of -9.93%.<BR><BR>For the 4-year period, the price return decreased by -17.88%, with a dividend return of 3.91%, resulting in a total return of -13.97%.<BR><BR>In the 5-year span, the price return increased by 5.2%, the dividend return was 7.14%, leading to a total return of 12.34%.<BR><BR>Overall, while Procter & Gamble Hygiene & Health Care Ltd. has declared a significant dividend, the total returns over various periods indicate a challenging performance, particularly in the shorter terms, with negative returns dominating. However, the 5-year period shows a positive total return, suggesting potential recovery or growth in the long term.

View full answer

How has been the historical performance of P&G Hygiene?

06-Nov-2025

P&G Hygiene has shown consistent growth in net sales, reaching 4,191.57 Cr in June 2024, but experienced a slight decline in profit after tax and cash flow from operating activities. Total assets and liabilities decreased, indicating potential restructuring despite strong sales performance.

Answer:<BR>The historical performance of P&G Hygiene shows a consistent upward trend in net sales and operating profit over the years, with net sales reaching 4,191.57 Cr in June 2024, up from 3,905.21 Cr in June 2023 and 3,792.45 Cr in June 2022. Operating profit also increased to 1,022.69 Cr in June 2024 from 909.21 Cr in June 2023. However, profit after tax saw a slight decline to 675.02 Cr in June 2024 from 678.14 Cr in June 2023. The company's total assets decreased to 1,783.69 Cr in June 2024 from 2,071.78 Cr in June 2023, while total liabilities also fell to 1,783.69 Cr in June 2024 from 2,071.78 Cr in June 2023. Cash flow from operating activities decreased to 470.00 Cr in June 2024 from 825.00 Cr in June 2023, indicating a tightening in cash generation.<BR><BR>Breakdown:<BR>P&G Hygiene has demonstrated a robust growth trajectory in net sales, which climbed from 3,001.99 Cr in June 2020 to 4,191.57 Cr in June 2024, reflecting a strong demand for its products. Operating profit, excluding other income, also showed a positive trend, increasing from 603.71 Cr in June 2020 to 970.44 Cr in June 2024, although the profit after tax slightly declined in the latest fiscal year. The company's total assets and liabilities both decreased in June 2024 compared to the previous year, suggesting a potential restructuring or reduction in operational scale. Furthermore, cash flow from operating activities has seen a decline, which may indicate challenges in maintaining liquidity despite the growth in sales and profits. Overall, while P&G Hygiene has achieved significant sales growth, the fluctuations in profit margins and cash flow warrant close monitoring.

View full answer

Is P&G Hygiene technically bullish or bearish?

04-Nov-2025

As of November 3, 2025, P&G Hygiene's trend is mildly bearish, influenced by daily moving averages and monthly MACD signals, despite some mildly bullish indicators on the weekly MACD.

As of 3 November 2025, the technical trend for P&G Hygiene has changed from bearish to mildly bearish. The current stance is mildly bearish, primarily driven by the daily moving averages indicating bearish momentum and the monthly MACD showing a bearish signal. The weekly MACD is mildly bullish, but this is offset by the monthly Bollinger Bands and KST both indicating bearish conditions. The RSI shows no signal in both weekly and monthly time frames, suggesting a lack of strong momentum in either direction. Overall, the mixed signals across different indicators reflect a weak bearish sentiment.

View full answer

Who are the top shareholders of the P&G Hygiene?

17-Jul-2025

The top shareholder of P&G Hygiene is Procter And Gamble Overseas India B.V. with 68.73%. Other significant shareholders include mutual funds at 8.26%, individual investors at 9.76%, and Foreign Institutional Investors at 1.33%.

The top shareholders of P&G Hygiene include Procter And Gamble Overseas India B.V., which holds the largest stake at 68.73%. Additionally, mutual funds collectively hold 8.26% through 15 schemes, with the SBI Focused Equity Fund being the highest public shareholder at 5.73%. Foreign Institutional Investors (FIIs) hold 1.33% through 108 entities, while individual investors account for 9.76% of the shareholding. There are no pledged promoter holdings reported.

View full answer

When is the next results date for P&G Hygiene?

06-Jun-2025

No Upcoming Board Meetings

iScoreScore
Click here to find our call on this stock
Strong Sell
Sell
Hold
Buy
Strong Buy

Dashboard

1

Poor long term growth as Net Sales has grown by an annual rate of 3.50% and Operating profit at 4.39% over the last 5 years

 
2

Negative results in Jun 26

3

With ROE of 104.9, it has a Expensive valuation with a 34.4 Price to Book Value

4

Consistent Underperformance against the benchmark over the last 3 years

stock-summaryMojo Parameters

Mojo Parameters

Loading Valuation Snapshot...

Stock DNA

stock-summary
Industry

FMCG

stock-summary
Market cap

INR 25,757 Cr (Mid Cap)

stock-summary
P/E

33.00

stock-summary
Industry P/E

44

stock-summary
Dividend Yield

2.44%

stock-summary
Debt Equity

-0.75

stock-summary
Return on Equity

104.94%

stock-summary
Price to Book

34.43

Revenue and Profits:
Net Sales:
890 Cr
(Quarterly Results - Jun 2026)
Net Profit:
126 Cr
stock-summaryTotal Returns
Total Returns (Price + Dividend) stock-summary
Dividend Yield (2.44%)
TimePeriod
Price Return
Dividend Return
Total Return
3 Months
-16.05%
0.65%
-15.4%
6 Months
-30.12%
0.54%
-29.58%
1 Year
-40.31%
1.73%
-38.58%
2 Years
-51.93%
3.03%
-48.9%
3 Years
-50.67%
3.80%
-46.87%
4 Years
-43.14%
5.50%
-37.64%
5 Years
-42.25%
7.18%
-35.07%

Latest dividend: 170 per share ex-dividend date: Feb-05-2026

Risk Adjusted Returns v/s stock-summary
Returns Beta
Icon
Beta has not been calculated since enough price history is not available
stock-summaryNews & Corporate Actions

Announcements stock-summary

Reg. 34 (1) Annual Report.

17-Aug-2026 | Source : BSE

Annual Report of the Company for the Financial Year ended March 31 2026

Business Responsibility and Sustainability Reporting (BRSR)

17-Aug-2026 | Source : BSE

Business Responsibility and Sustainability Report for the Financial Year ended March 31 2026

Notice Of Annual General Meeting Of The Company Scheduled To Be Held On September 8 2026

17-Aug-2026 | Source : BSE

Notice of Annual General Meeting of the Company

Corporate Actions stock-summary

stock-summary
BOARD MEETING

No Upcoming Board Meetings

stock-summary
DIVIDEND

Procter & Gamble Hygiene & Health Care Ltd. has declared 600% dividend, ex-date: 01 Sep 26

stock-summary
SPLITS

No Splits history available

stock-summary
BONUS

No Bonus history available

stock-summary
RIGHTS

No Rights history available

stock-summaryKey Factors

Quality key factors stock-summary

Factor
Value
Sales Growth (5y)
3.50%
EBIT Growth (5y)
4.39%
EBIT to Interest (avg)
71.66
Debt to EBITDA (avg)
Net Debt is too low
Net Debt to Equity (avg)
-0.75
Sales to Capital Employed (avg)
4.78
Tax Ratio
26.21%
Dividend Payout Ratio
89.23%
Pledged Shares
0
Institutional Holding
16.56%
ROCE (avg)
-102.93%
ROE (avg)
82.27%

Valuation key factors

Factor
Value
P/E Ratio
33
Industry P/E
44
Price to Book Value
34.43
EV to EBIT
24.47
EV to EBITDA
23.60
EV to Capital Employed
136.12
EV to Sales
5.98
PEG Ratio
NA
Dividend Yield
2.44%
ROCE (Latest)
608.16%
ROE (Latest)
104.94%

Technicals key factors

Indicator
Weekly
Monthly
MACD
Mildly Bullish
Bearish
RSI
No Signal
No Signal
Bollinger Bands
Bearish
Bearish
Moving Averages
Bearish (Daily)
KST
Bearish
Bearish
Dow Theory
Mildly Bearish
Mildly Bearish
OBV
No Trend
Bullish
stock-summary Technical Indicator Scale: Bearish, Mildly Bearish, Sideways, Mildly Bullish, Bullish  Turned 
stock-summaryShareholding
Shareholding Snapshot : Jun 2026stock-summary
Shareholding Compare (%holding) stock-summary
Majority shareholders

Promoters

Pledged Promoter Holdings

None

Mutual Funds

Held by 13 Schemes (8.0%)

FIIs

Held by 100 FIIs (0.98%)

Promoter with highest holding

Procter And Gamble Overseas India B.v. (68.73%)

Highest Public shareholder

Sbi Focused Fund (5.06%)

Individual Investors Holdings

10.04%

stock-summaryFinancial
[
  {
    "link": "quarterly",
    "btn_text": "All Quarterly Results",
    "header": "Quarterly Results Snapshot (Standalone) - Jun'26 - YoY",
    "rhs": [
      {
        "prefix": "Net Sales ",
        "suffix": "YoY Growth in quarter ended Jun 2026 is -4.84% vs 0.83% in Jun 2025",
        "dir": -1
      },
      {
        "prefix": "Standalone Net Profit ",
        "suffix": "YoY Growth in quarter ended Jun 2026 is -34.25% vs 136.94% in Jun 2025",
        "dir": -1
      }
    ],
    "table": {
      "header": [
        "Jun'26",
        "Jun'25",
        "Change(%)"
      ],
      "body": [
        {
          "field": "Net Sales",
          "val1": "889.92",
          "val2": "935.16",
          "chgp": "-4.84%",
          "chgp_class": "negative"
        },
        {
          "field": "Operating Profit (PBDIT) excl Other Income",
          "val1": "170.06",
          "val2": "266.17",
          "chgp": "-36.11%",
          "chgp_class": "negative"
        },
        {
          "field": "Interest",
          "val1": "0.27",
          "val2": "0.07",
          "chgp": "285.71%",
          "chgp_class": "negative"
        },
        {
          "field": "Exceptional Items",
          "val1": "0.00",
          "val2": "0.00",
          "chgp": "",
          "chgp_class": "neutral"
        },
        {
          "field": "Standalone Net Profit",
          "val1": "126.27",
          "val2": "192.06",
          "chgp": "-34.25%",
          "chgp_class": "negative"
        },
        {
          "field": "Operating Profit Margin (Excl OI)",
          "val1": "19.11%",
          "val2": "28.46%",
          "chgp": "-9.35%",
          "chgp_class": "negative"
        }
      ]
    }
  },
  {
    "link": "half-yearly",
    "btn_text": "All Half Yearly Results",
    "header": "Half Yearly Results Snapshot (Standalone) - Sep'25",
    "rhs": [
      {
        "prefix": "Net Sales ",
        "suffix": "Not Applicable: The company has declared_date for only one period",
        "dir": 0
      },
      {
        "prefix": "Standalone Net Profit ",
        "suffix": "Not Applicable: The company has declared_date for only one period",
        "dir": 0
      }
    ],
    "table": {
      "header": [
        "Sep'25",
        "Sep'24",
        "Change(%)"
      ],
      "body": [
        {
          "field": "Net Sales",
          "val1": "2,084.01",
          "val2": "2,060.16",
          "chgp": "1.16%",
          "chgp_class": "positive"
        },
        {
          "field": "Operating Profit (PBDIT) excl Other Income",
          "val1": "550.93",
          "val2": "408.82",
          "chgp": "34.76%",
          "chgp_class": "positive"
        },
        {
          "field": "Interest",
          "val1": "3.67",
          "val2": "1.88",
          "chgp": "95.21%",
          "chgp_class": "negative"
        },
        {
          "field": "Exceptional Items",
          "val1": "0.00",
          "val2": "0.00",
          "chgp": "",
          "chgp_class": "neutral"
        },
        {
          "field": "Standalone Net Profit",
          "val1": "401.92",
          "val2": "292.96",
          "chgp": "37.19%",
          "chgp_class": "positive"
        },
        {
          "field": "Operating Profit Margin (Excl OI)",
          "val1": "26.44%",
          "val2": "19.84%",
          "chgp": "6.60%",
          "chgp_class": "positive"
        }
      ]
    }
  },
  {
    "link": "nine-monthly",
    "btn_text": "All Nine Monthly Results",
    "header": "Nine Monthly Results Snapshot (Standalone) - Dec'25",
    "rhs": [
      {
        "prefix": "Net Sales ",
        "suffix": "YoY Growth in nine months ended Dec 2025 is 1.13% vs 1.29% in Dec 2024",
        "dir": -1
      },
      {
        "prefix": "Standalone Net Profit ",
        "suffix": "YoY Growth in nine months ended Dec 2025 is 25.26% vs -5.46% in Dec 2024",
        "dir": 1
      }
    ],
    "table": {
      "header": [
        "Dec'25",
        "Dec'24",
        "Change(%)"
      ],
      "body": [
        {
          "field": "Net Sales",
          "val1": "3,343.92",
          "val2": "3,306.41",
          "chgp": "1.13%",
          "chgp_class": "positive"
        },
        {
          "field": "Operating Profit (PBDIT) excl Other Income",
          "val1": "952.73",
          "val2": "779.75",
          "chgp": "22.18%",
          "chgp_class": "positive"
        },
        {
          "field": "Interest",
          "val1": "6.34",
          "val2": "8.50",
          "chgp": "-25.41%",
          "chgp_class": "positive"
        },
        {
          "field": "Exceptional Items",
          "val1": "0.00",
          "val2": "0.00",
          "chgp": "",
          "chgp_class": "neutral"
        },
        {
          "field": "Standalone Net Profit",
          "val1": "703.38",
          "val2": "561.55",
          "chgp": "25.26%",
          "chgp_class": "positive"
        },
        {
          "field": "Operating Profit Margin (Excl OI)",
          "val1": "28.45%",
          "val2": "23.53%",
          "chgp": "4.92%",
          "chgp_class": "positive"
        }
      ]
    }
  },
  {
    "link": "annual",
    "btn_text": "All Annual Results",
    "header": "Annual Results Snapshot (Standalone) - Mar'26",
    "rhs": [
      {
        "prefix": "Net Sales ",
        "suffix": "Not Applicable: The company has declared_date for only one period",
        "dir": 0
      },
      {
        "prefix": "Standalone Net Profit ",
        "suffix": "Not Applicable: The company has declared_date for only one period",
        "dir": 0
      }
    ],
    "table": {
      "header": [
        "Mar'26",
        "Mar'25",
        "Change(%)"
      ],
      "body": [
        {
          "field": "Net Sales",
          "val1": "4,281.59",
          "val2": "3,368.11",
          "chgp": "27.12%",
          "chgp_class": "positive"
        },
        {
          "field": "Operating Profit (PBDIT) excl Other Income",
          "val1": "1,171.04",
          "val2": "871.06",
          "chgp": "34.44%",
          "chgp_class": "positive"
        },
        {
          "field": "Interest",
          "val1": "9.45",
          "val2": "14.30",
          "chgp": "-33.92%",
          "chgp_class": "positive"
        },
        {
          "field": "Exceptional Items",
          "val1": "0.00",
          "val2": "0.00",
          "chgp": "",
          "chgp_class": "neutral"
        },
        {
          "field": "Standalone Net Profit",
          "val1": "856.50",
          "val2": "636.59",
          "chgp": "34.54%",
          "chgp_class": "positive"
        },
        {
          "field": "Operating Profit Margin (Excl OI)",
          "val1": "27.35%",
          "val2": "25.86%",
          "chgp": "1.49%",
          "chgp_class": "positive"
        }
      ]
    }
  }
]

Quarterly Results Snapshot (Standalone) - Jun'26 - YoYstock-summary

Jun'26
Jun'25
Change(%)
Net Sales
889.92
935.16
-4.84%
Operating Profit (PBDIT) excl Other Income
170.06
266.17
-36.11%
Interest
0.27
0.07
285.71%
Exceptional Items
0.00
0.00
Standalone Net Profit
126.27
192.06
-34.25%
Operating Profit Margin (Excl OI)
19.11%
28.46%
-9.35%
Values in Rs Cr.
Direction Arrows
Net Sales

YoY Growth in quarter ended Jun 2026 is -4.84% vs 0.83% in Jun 2025

Direction Arrows
Standalone Net Profit

YoY Growth in quarter ended Jun 2026 is -34.25% vs 136.94% in Jun 2025

Half Yearly Results Snapshot (Standalone) - Sep'25stock-summary

Sep'25
Sep'24
Change(%)
Net Sales
2,084.01
2,060.16
1.16%
Operating Profit (PBDIT) excl Other Income
550.93
408.82
34.76%
Interest
3.67
1.88
95.21%
Exceptional Items
0.00
0.00
Standalone Net Profit
401.92
292.96
37.19%
Operating Profit Margin (Excl OI)
26.44%
19.84%
6.60%
Values in Rs Cr.
Net Sales

Not Applicable: The company has declared_date for only one period

Standalone Net Profit

Not Applicable: The company has declared_date for only one period

Nine Monthly Results Snapshot (Standalone) - Dec'25stock-summary

Dec'25
Dec'24
Change(%)
Net Sales
3,343.92
3,306.41
1.13%
Operating Profit (PBDIT) excl Other Income
952.73
779.75
22.18%
Interest
6.34
8.50
-25.41%
Exceptional Items
0.00
0.00
Standalone Net Profit
703.38
561.55
25.26%
Operating Profit Margin (Excl OI)
28.45%
23.53%
4.92%
Values in Rs Cr.
Direction Arrows
Net Sales

YoY Growth in nine months ended Dec 2025 is 1.13% vs 1.29% in Dec 2024

Direction Arrows
Standalone Net Profit

YoY Growth in nine months ended Dec 2025 is 25.26% vs -5.46% in Dec 2024

Annual Results Snapshot (Standalone) - Mar'26stock-summary

Mar'26
Mar'25
Change(%)
Net Sales
4,281.59
3,368.11
27.12%
Operating Profit (PBDIT) excl Other Income
1,171.04
871.06
34.44%
Interest
9.45
14.30
-33.92%
Exceptional Items
0.00
0.00
Standalone Net Profit
856.50
636.59
34.54%
Operating Profit Margin (Excl OI)
27.35%
25.86%
1.49%
Values in Rs Cr.
Net Sales

Not Applicable: The company has declared_date for only one period

Standalone Net Profit

Not Applicable: The company has declared_date for only one period

stock-summaryCompany CV
About Procter & Gamble Hygiene & Health Care Ltd. stock-summary
stock-summary
Procter & Gamble Hygiene & Health Care Ltd.
Mid Cap
FMCG
Procter & Gamble Hygiene and Health Care Limited (P&GHHCL) is engaged in manufacturing and selling of branded packaged fast moving consumer goods in the femcare and healthcare businesses. The Company's products are sold through retail operations including mass merchandisers, grocery stores, membership club stores, drug stores, department stores and high frequency stores.
Company Coordinates stock-summary
Company Details
P & G Plaza Chakala, Cardinal Gracias Rd Andheri(E) Mumbai Maharashtra : 400099
stock-summary
Tel: 91-22-28266000
stock-summary
investorpghh.i@pg.com
Registrar Details
Link Intime India Pvt Ltd, C-13 Pannalal Silk Compound, L B S Marg, Bhandup , Mumbai